Is the Stock Market Overvalued?
The question of whether the stock market is overvalued is one that we field on an almost daily basis. The problem is, there are no easy answers. That’s because there are so many methods used to measure valuations that, unless you understand them all, it’s hard to form an opinion on which one is correct at any given point in time. Add in a personal bias towards a particular method, and you’ve really complicated the discussion.
The goal of this article is to help you understand all the different methods, at least in a cursory fashion, and the pros and cons of each. By doing so, you can begin to form your own opinion on this subject. Some of you will change your minds, some of you will have your opinions validated, and hopefully, all of you will be able to take away some knowledge that you didn’t have before.
Before we begin today, I want to start with some basics about valuations in general. The stock market can, and does, remain overvalued or undervalued for FAR longer than anyone can anticipate. Therefore, valuations are not good short term indicators. They just aren’t, and anyone that tells you they are is selling something you probably don’t want to buy. With that out of the way, let’s get to it.
Valuation Methods
Most methods for calculating the relative value of the stock market as a whole use some form of Price to Earnings Ratio or PE in their determination. So let’s first understand what that means. We’ll discuss it in terms of an individual company to simplify the concept.
Price to Earnings Ratio
The PE of a company is the ratio of a company’s current share price to its earnings per share (EPS). EPS is also called the price multiple or the earnings multiple. Investors use that ratio to determine the relative value of a company’s stock and compare it to similar companies or the overall market.
In practice, what the PE tells us is what dollar amount investors are willing to pay per share to receive a dollar of the company’s earnings. Thus the term price multiple. So, for example, a company that has a PE of 20, you’ll pay $20 for every $1 in earnings you expect to receive from that company because that’s what the market is currently willing to pay.
A high PE might mean that the stock price is high relative to the company’s earnings and is, therefore, overvalued.
On the other hand, a low PE may mean that the stock price is low relative to the company’s earnings, and is possibly undervalued. We can apply the same principles to the market as a whole; it’s just a more complicated exercise.
The calculation is the same; Current Share Price divided by Earnings Per Share. It’s just that you have to figure that out for all 500 companies in the index if you’re looking to find the PE for the S&P 500.
Types of PE Ratios
Now that you understand the basics of the PE ratio, you need to understand the different types that are out there. Here’s a brief list of the ones I can think of off the top of my head:
Forward PE, Trailing PE, Cyclically Adjusted PE, Absolute PE, and Relative PE.
Each of these use the same basic calculations, but they use different time frames. For example, forward PE measures the current price versus the expected earnings over the next 12 months. Obviously, if you project the earnings to be higher over the next 12 months and use that as the divisor for the stock price, your PE will be lower. The use of this method is mostly in financial media when discussing whether or not the market is over or undervalued.
Trailing PE and CAPE
Trailing PE simply uses the last 12 month average of share price and earnings, which doesn’t skew your numbers as forward PE does. It just smooths out quarterly and annual fluctuations that may affect individual companies in specific industries. Cyclically Adjusted PE or CAPE does the same thing as trailing PE but over a longer historical timeframe of the trailing ten years.
It does a great job of smoothing out peaks and valleys in the data and gives, what some believe, is a more realistic look at overall market valuation. This is the method developed by Dr. Robert Shiller and one we’ll be discussing later in the article in more detail. There are also some contemporaries of his we’ll talk about as well. One is Nobel Lauriat James Tobin, who developed the Q-Ratio. The other is Ed Easterlings Crestmont Research who developed the Crestmont PE.
Absolute & Relative PEs
Not to be forgotten are Absolute and Relative PEs. The Absolute PE is simply the PE for the current timeframe measured, whether using trailing or forward EPS as the denominator or a combination of both. Relative PE is the current PE versus the historical PE’s from a select time frame, say 5 or 10 years, to understand where today’s PE is relative to past PE’s highs and lows. This can help determine whether the PE currently is near the high or low end of the historical spectrum and, therefore, whether a stock is relatively expensive or a relative bargain.
Are you thoroughly confused yet? If not, hang in there. There’s more.
Looking at Long-Term Data to Determine if the Stock Market is Overvalued
When determining whether the stock market is overvalued or not, I prefer to have more data than less. It just makes sense to me, because you can’t know with any certainty if what’s happening today is unprecedented or not if you’re only looking back 10, 20, even 50 years.
The timeline isn’t long enough to gain a proper historical perspective. Unfortunately, that’s what far too many people do. They make decisions based on too short of a time horizon, and they don’t understand where the market or even an individual stock is from a longer-term perspective. One of the best places I’ve found, though I use several, for the historical perspective I’m looking for is DShort.com.
Every month they produce some of the best and most informative charts and graphs you’ll find. Take, for instance, Figure 1 below, a multi-decade regression trend of the S&P Composite. The chart goes all the way back to the late 1800s and comes forward through today. It shows the market’s value versus the trend line over that timeframe and gives a brilliant insight into what’s happening today versus the past.

Figure 1 | Source: DShort – Advisor Perspectives
Note that the S&P Composite is currently 119% above the trend line. It’s much higher than it was after the roaring 20s, much higher than before the financial crisis in 2007, and nearly as high as before the Dot Com Bubble burst in 2000.
From a historical perspective, the market is definitely overvalued, but it’s been overvalued for the last 20 years. Except for a brief dip below trend by early 2009 that quickly reversed.
S&P Composite Index Regression Trend
So remember what I said at the outset, markets can remain over or undervalued for FAR longer than anyone thinks. You certainly wouldn’t want to use this information to make short term trading decisions, because you would have been wrong for the last 20 years. Let’s look at this chart again in Figure 2, except this time, with the trend line set to zero.
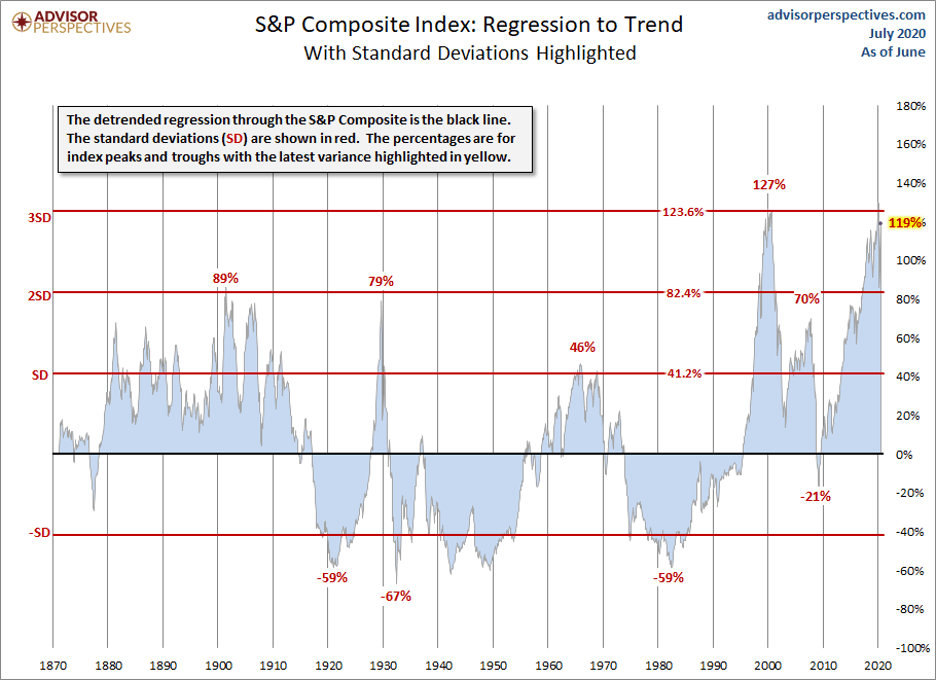
Figure 2 | Source: DShort – Advisor Perspectives
Notice the standard deviation marks above and below the trend line.
In this case, one standard deviation is 41.2%. The peak of the market just before the great depression was two standard deviations above trend, and it subsequently fell to roughly 1-1/2 standard deviations below trend (-67%) before it bottomed. The year 2000 saw a peak above three standard deviations. If you remember the bell curve, three standard deviations is where 99.7% of all occurrences are found. And today, even after the wild swings due to the COVID-19 panic, we’re still very near three standard deviations above trend. Can we go higher? Absolutely. The question is how much, and for how long? Or is it? We may need to talk for a minute about how stock market overvaluations come back to trend or fair value, which is what we’ll refer to trend as in the next segment before we move on.
How does an Overvalued Stock Market get back to “Fair Value”?
Remember, the formula to figure out the PE ratio is the share price divided by earnings per share. The higher the share price is versus the denominator of earnings, the higher the PE will be. What could change that? Well, first of all, the price could come down. The lower price to the steady earnings would lower the PE ratio, right?
But what if the price stayed flat at their elevated levels, and earnings came up to meet or exceed expectations? If my earnings per share are higher than the price per share, my PE goes down without the price having to come down. You following me here?
Let’s take our stock with a PE of 20 from earlier. Let’s assume that the share price is $20, and the earnings per share is a dollar. That’s our PE of 20. Now, let’s assume that the earnings per share doubled to $2. Under that scenario, my new PE is 10! All of a sudden, an overvalued stock is undervalued, and the price didn’t change. Conversely, but much more painfully for the shareholders, if the price drops by 50% to $10 and the earnings per share remain the same at one dollar, my new PE is also 10, and maybe a bargain, but someone suffered for someone else to get a bargain.
As we continue, these are the two ways that a stock market that appears to be overvalued today can come back to fair value. They are the only two ways. Everything else (share buybacks and the like) is hocus pocus designed to make the shareholders and board members feel good, with very few exceptions. Let’s move on now.
Shiller, Crestmont, and Tobin in Detail
Robert Shiller, Ed Easterling, and James Tobin are all exceptionally intelligent men. I’m so thankful for their work in this area because they’ve given me the ability to get the detailed, long-range historical look back I need in doing my job. Let’s break down each of their valuation measurements, and I’ll give you examples of each. Then we’ll tie it all together via the work of DShort in blending the valuations from each into one composite valuation indicator.
Shiller
We’ll start with Robert Shiller because he’s probably the most recognizable name. Let’s first examine the anomalies that can happen with valuations using trailing 12-month earnings to calculate PE. Notice the spike on Figure 3 below in the middle of the financial crisis.
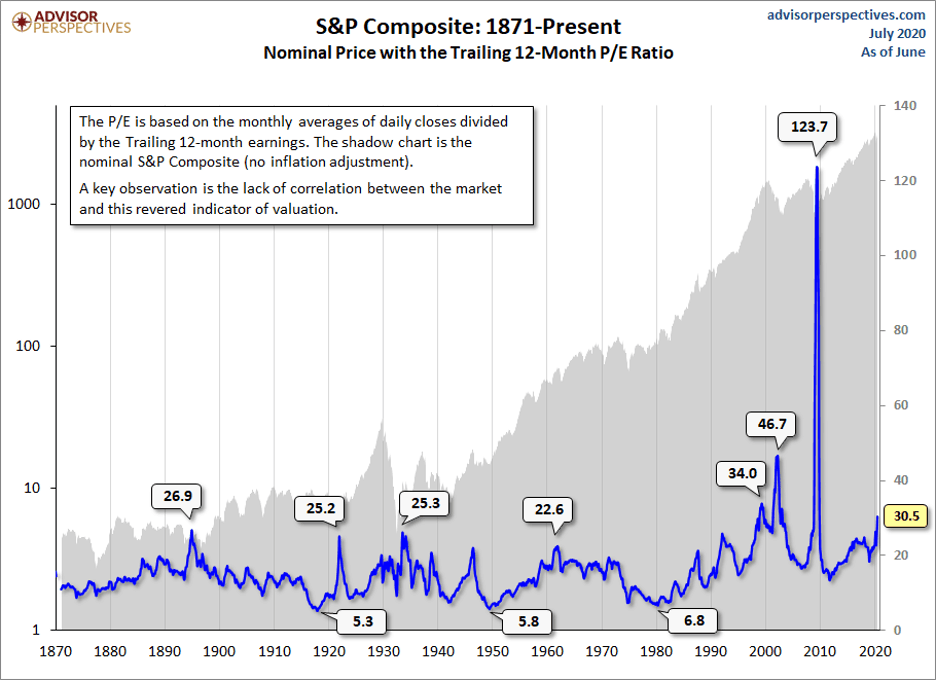
Figure 3 | Source: DShort – Advisor Perspectives
The PE of the S&P Composite spiked to 123.7 in 2009, as prices were cratering. Based on our discussion about how markets get back to fair value, this should never have happened. But it did.
The problem was that earnings fell faster than prices in that timeframe and went negative, something that had never happened in the S&P history. Thus you get PE readings that are absolutely meaningless and downright misleading.
CAPE
Economist Benjamin Graham noticed this same bizarre P/E behavior during the Roaring Twenties and subsequent market crash. He decided to work with David Dodd to figure out a more accurate way to calculate the market’s value. As a result of their work, they determined the illogical P/E ratios they witnessed were due to temporary, and sometimes extreme, fluctuations in the business cycle. Their solution was to divide the price by a multi-year average of earnings and suggested 5, 7, or 10-years. Yale professor, and Nobel laureate, Robert Shiller, has taken this concept and made it readily available to all investors. He selected the 10-year average of “real” (inflation-adjusted) earnings as the denominator, and he refers to this ratio as the Cyclically Adjusted Price Earnings Ratio, abbreviated as CAPE. This is also referred to as the PE/10 ratio because it uses the ten years trailing.
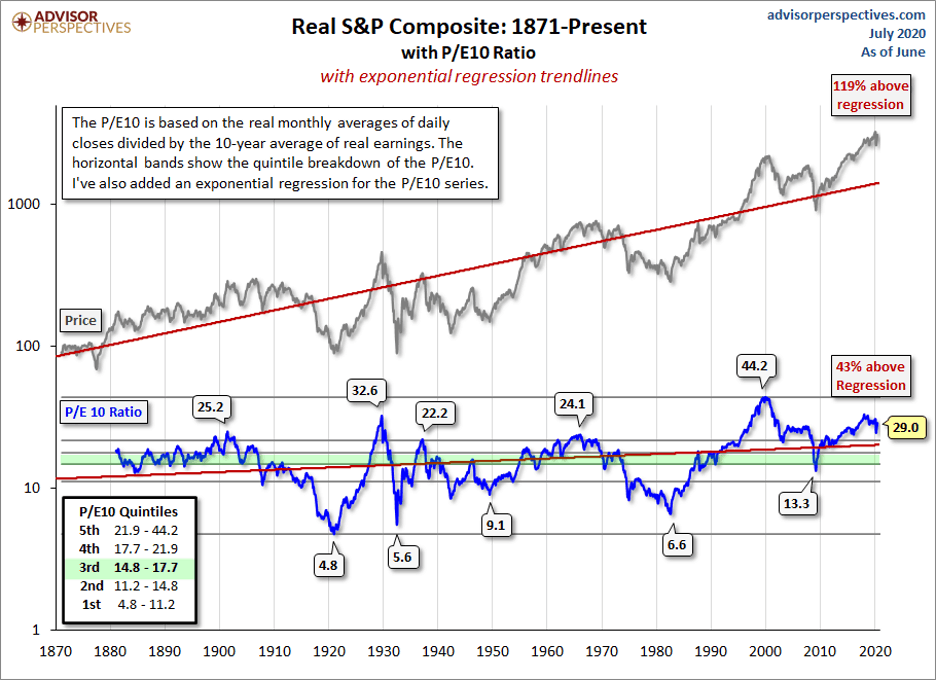
Figure 4 | Source: DShort – Advisor Perspectives
This chart shows the trend regression of the CAPE or PE/10 going all the way back to 1871 versus the S&P Composite. Note the eerie similarity. It’s interesting to note that the average CAPE over this time frame is 17, and we’re currently (at the end of June) sitting at 29. While that’s certainly elevated, it’s not the highest levels we’ve seen, by a long shot. Based on these numbers, even though the stock market is clearly overvalued today, it can obviously go higher if history is our guide.
Overvaluation as a Percentage Above Mean Valuation
Viewed differently, you can see in Figure 5 below the overvaluation shown as a percentage above the mean valuation, shown as the zero line in the chart. The CAPE is currently 84% above its mean valuation, which is quite elevated. You can see the effects of the interest rate, tariff, and COVID-19 panic, which occurred since the 4th quarter of 2018 on the far right-hand side of the chart as valuations fluctuated wildly.
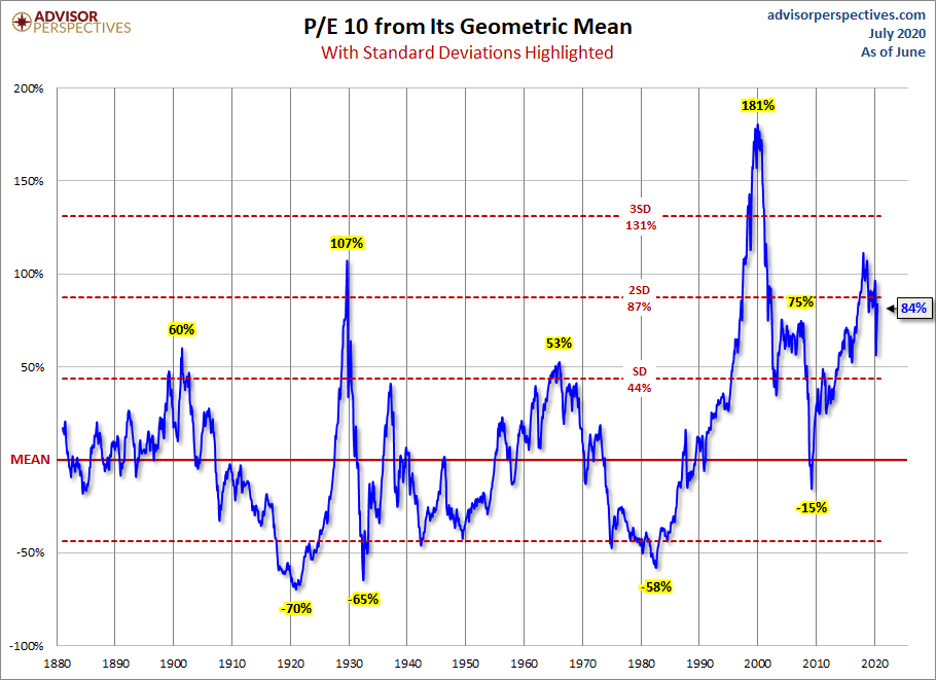
Figure 5 | Source: DShort – Advisor Perspectives
And though there have been plenty of market drops over that time, valuations remain extremely elevated.
Crestmont
Ed Easterling, the founder of Crestmont Research, recognized the value in the methodology of Robert Shiller’s CAPE, but found the inherent time lag in values could be a drawback. So, he decided to modify the calculation to account for current economic growth. Ed’s theory uses the fundamental relationship between Gross Domestic Product (GDP) and Earnings. In his article P/E So Many Choices published in 2011, he notes the following:
“The fundamental relationship is driven by two elements. First, GDP essentially represents composite revenues. Second, profits emanate from revenues. Therefore, over time, profits grow in line with economic growth.”
“Although economic growth has some variability, earnings has its own cycle from the business cycle of competitive market forces. It is the second cycle that most affects EPS due to its frequency and magnitude. Over time, however, EPS reverts back to its baseline relationship to GDP. Economists recognize that the profit margins cycle is one of the most mean reverting cycles in the economy. Therefore, profits (as reflects in EPS for public companies) has a strong and fundamentally-driven relationship with GDP.”
To obtain a normalized EPS for his valuations, Ed uses overlapping 50-year regressions of nominal GDP and actual reported EPS. This allows him to smooth the business cycle distortions in the EPS and generate an accurate, current valuation. The results look very similar to the CAPE, though their values are different. Take a look at Figure 6 below.
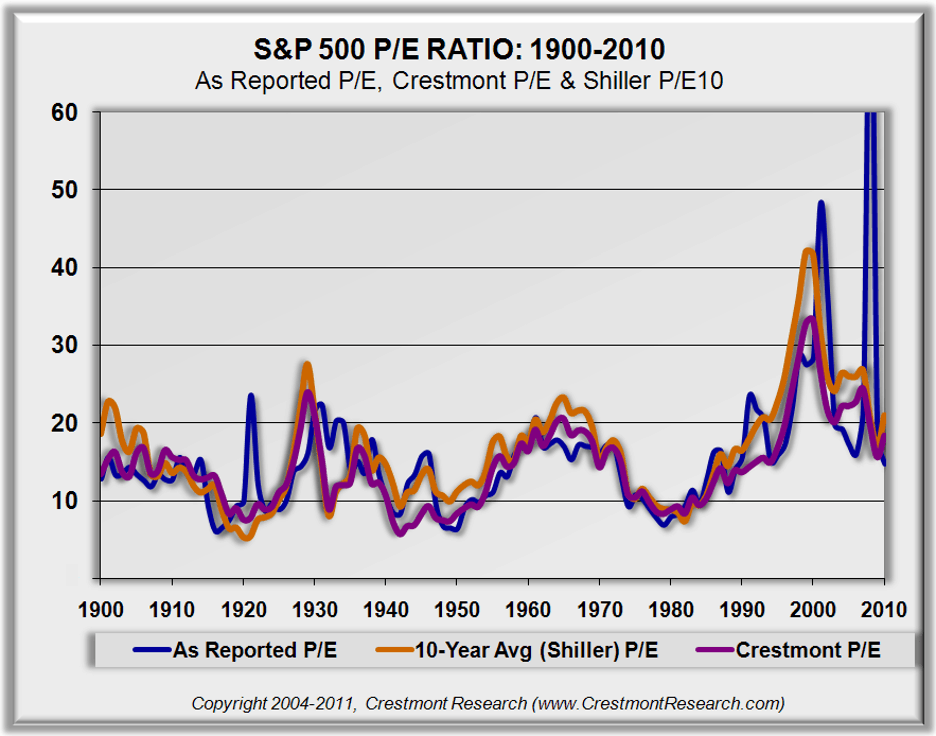
Figure 6 | Source: Crestmont Research
Crestmont & Shiller CAPE
Note how they both eliminated the crazy spike in PE that occurred in 2009. Both methodologies work as intended, and both provide valuable insight. While some prefer to choose one over the other, I believe more information is better, which is why I like them both. Below in Figures 7 and 8 are the Crestmont regression and overvaluation charts that look very similar to those of the Shiller CAPE charts.
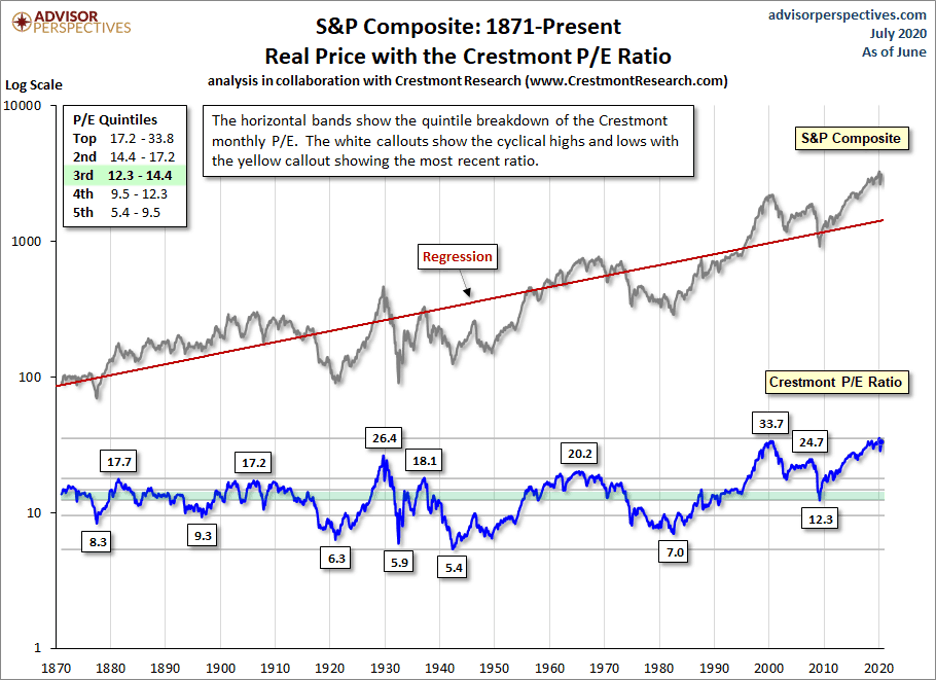
Figure 7 | Source: DShort – Advisor Perspectives
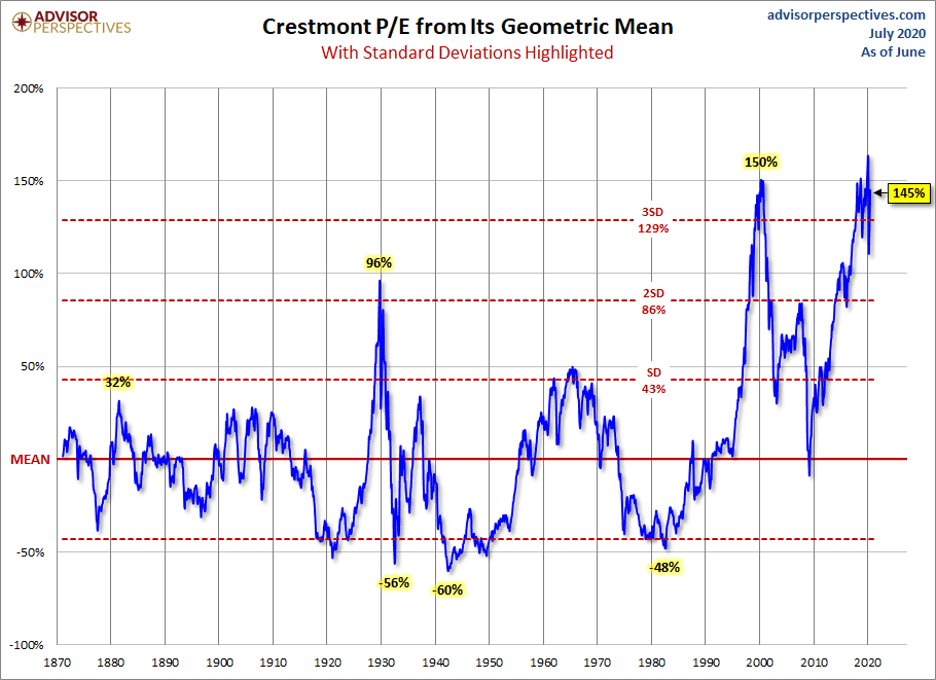
Figure 8 | Source: DShort – Advisor Perspectives
This chart really illustrates the effect of using the GDP and Earnings data that Ed included in his valuation method. His calculation shows the market is currently overvalued by a full three standard deviations, and almost as high as the valuations of 2000 just before the Dot Com Bubble bursting. It also shows that the Crestmont hit a peak HIGHER than the dot-com bubble in February of this year…again a factor of using the GDP and Earnings regression data in the calculation. This is probably the most troubling chart of any you’ll see, for obvious reasons.
Tobin’s Q-Ratio
And finally, let’s talk about James Tobin’s Q-Ratio for a bit before we tie all these measures together. James Tobin developed the Q-Ratio as a measurement of the total market value divided by all its companies’ replacement cost. You can find this data in the Federal Reserve Z.1 Statistical Release, section B.103, Balance Sheet and Reconciliation Tables for Nonfinancial Corporate Business.
The drawback with Tobin is the data is always lagging by two months, and only updated quarterly. As a surrogate, for monthly calculations, they use the Vanguard Total Market ETF to represent corporate equities. The average Q-Ratio is .78, which is a little counterintuitive. One might think that a ratio of 1:1 would represent fair value, but the replacement costs of corporate assets tend to be overstated (shocking, right?)
Below are the current levels of the Q-Ratio in Figures 9 and 10.
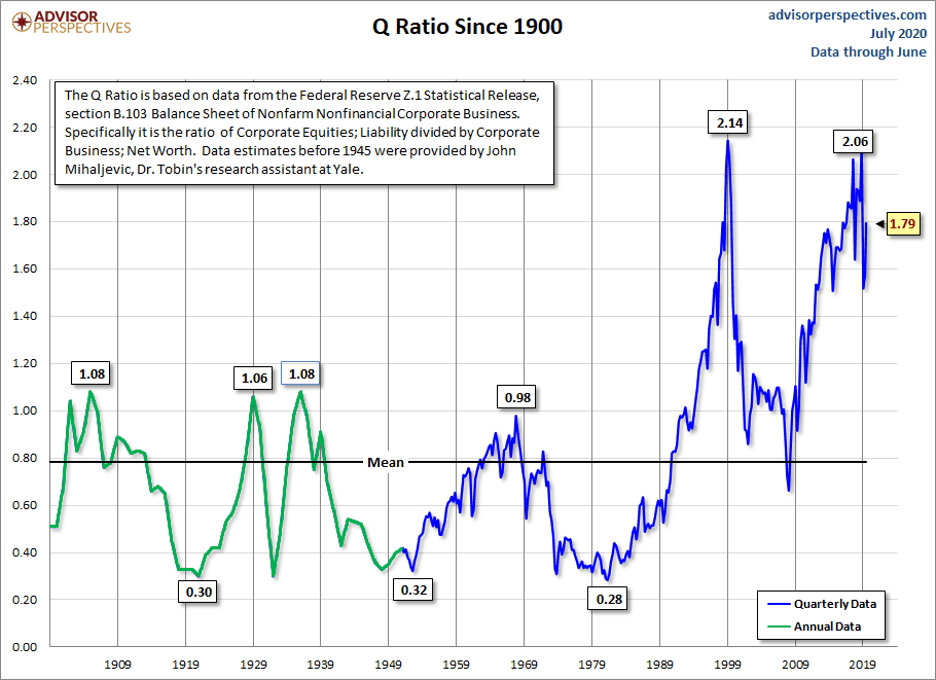
Figure 9 | Source: DShort – Advisor Perspectives
Note here the Q-ratio meant a company in 2000 was priced at 2.14 times the replacement cost of all its assets. That seems pretty steep to me. And as recently as last year, the Q-Ratio was as high as 2.06. It currently sits at 1.7 times total replacement cost.
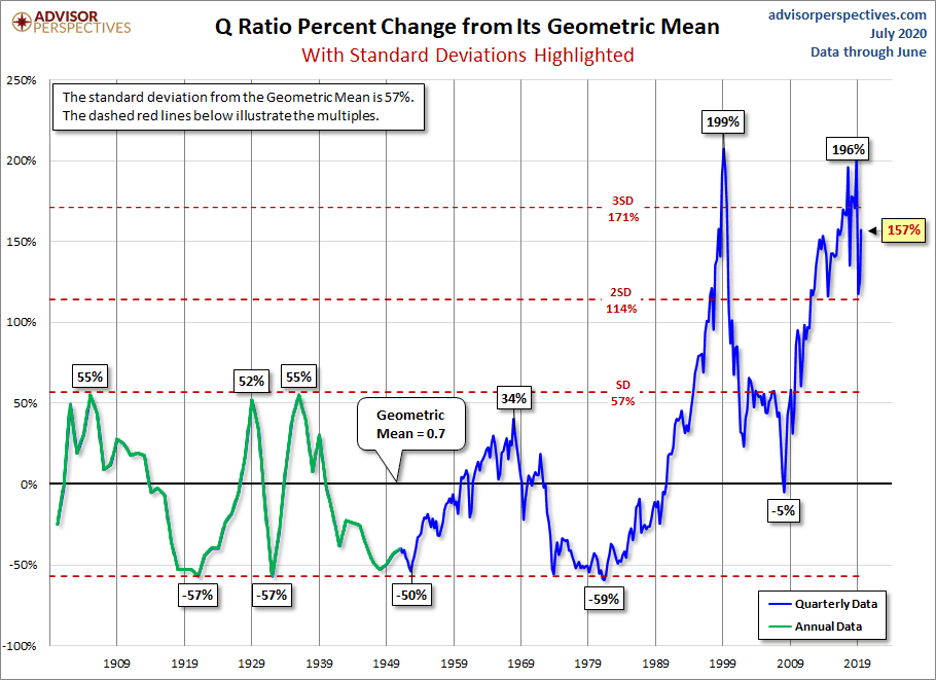
Figure 10 | Source: DShort – Advisor Perspectives
The Q-Ratio is currently just under three standard deviations above its mean, which indicates a pretty overvalued stock market. Its 157% above mean, or fair value, but still well below the recent peak of 196% above fair value.
With Our Powers Combined…
By themselves, the Composite regression, the CAPE, the Crestmont, and the Q-Ratio are all exceedingly valuable tools, created by exceptionally intelligent people, to help us understand the value of the market and whether or not it’s expensive or cheap.
However, when you blend them all into a single measurement, you get a valuation measurement that takes advantage of all the strengths. Minimizing the weaknesses of all as well, and that is easy to read. Let’s first look at all of them on one chart in Figure 11 to see the correlation between the 4.
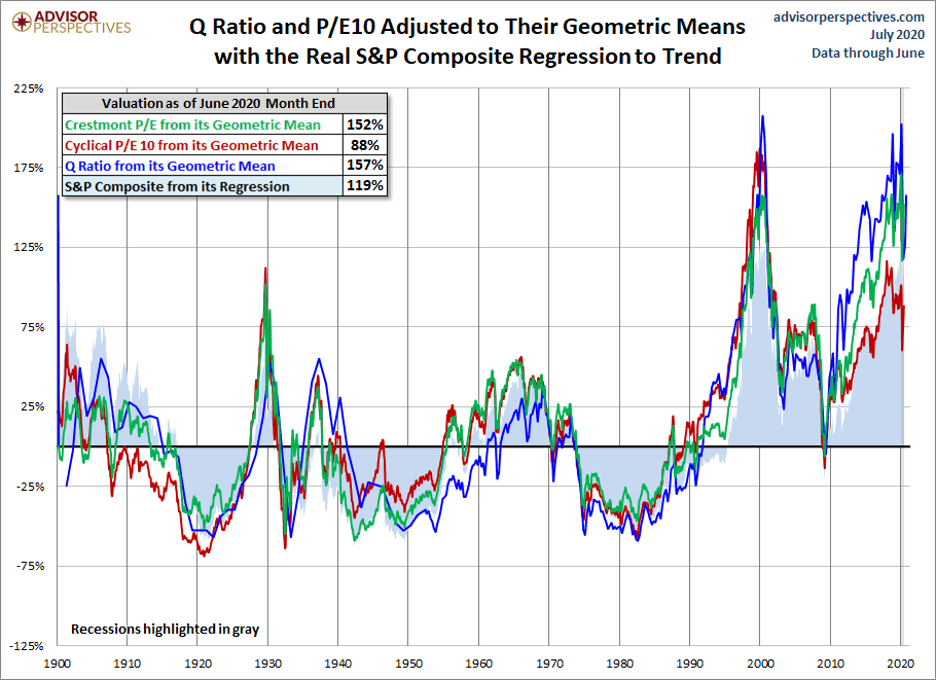
Figure 11 | Source: DShort – Advisor Perspectives
The correlation is undeniable, but the differences are recognizable as well. That, to me, is the beauty of this blend of measurements. But, it’s a little challenging to read a chart this busy. The following chart, Figure 12, is the one I go to DShort for every month, without fail, because it distills all the information down into one combined valuation measurement that is easy to read and understand.
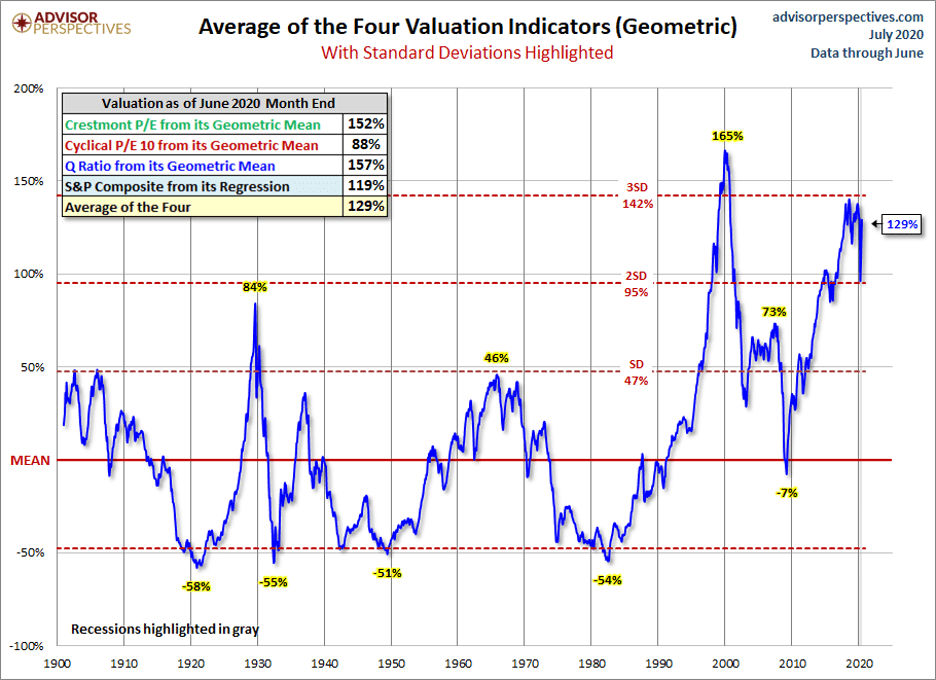
Figure 12 | Source: DShort – Advisor Perspectives
So, Is the Stock Market Overvalued?
See what I mean. Clear, concise, and to the point. And answers the question we asked at the beginning of the article, is the stock market overvalued? The answer is obviously yes. However, keep in mind what we also talked about at the beginning of the article.
The markets can, and do, remain elevated for far longer than anyone thinks is possible. With history as our guide, they can go quite a bit higher from here without setting a new record. They are currently 129% above the mean valuation going back to 1871, but they were 165% above mean valuation in 2000, just before the Dot Com Bubble burst.
The questions for the near term are: Will the economy continue to expand after COVID-19 panic? Will the states allow their economies to remain open for business and not make the same economically disastrous decisions they made in March? If the answer is yes, the overvaluations are not as big of an issue because economic growth should contribute to higher earnings, which will bring the PE ratios back down to earth, as we discussed earlier. If, however, several states decide to repeat their mistakes, it seems like prices are going to be the things that bring the PE ratios back down to earth. I certainly prefer the former to the latter. Only time will tell, and we should know soon.
Schedule Complimentary Consultation
Select the office you would like to meet with. We can meet in-person, by virtual meeting, or by phone. Then it’s just two simple steps to schedule a time for your Complimentary Consultation.
Lenexa Office Lee’s Summit Office North Kansas City Office
Investment advisory services offered through Modern Wealth Management, Inc., an SEC Registered Investment Adviser.
The views expressed represent the opinion of Modern Wealth Management an SEC Registered Investment Advisor. Information provided is for illustrative purposes only and does not constitute investment, tax, or legal advice. Modern Wealth Management does not accept any liability for the use of the information discussed. Consult with a qualified financial, legal, or tax professional prior to taking any action.