A Recent History of Inverted Yield Curves
Key Points – A Recent History of Inverted Yield Curves
- The First Inverted Yield Curve Since Late 2019
- Is a Recession Imminent?
- More Volatility to Come
- 4 minutes to read | 9 minutes to listen
We have an inverted yield curve for the first time since late 2019. Dean Barber reviews every time that we’ve experienced an inverted yield curve since 1976 and how recessions have followed. That doesn’t mean that a recession is imminent, but let’s compare this inverted yield curve to ones of the past.
Get a Complimentary Consultation Subscribe on YouTube
What Is an Inverted Yield Curve?
Dean Barber: I’m Dean Barber, the founder and CEO of Modern Wealth Management. Here is our Monthly Economic Update for March.
Let’s dive right into looking at the yield curve. First, I want to try to give you an explanation on what an inverted yield curve is. When we look at an inverted yield curve, we’re looking at the short-term yields. In this case, we’re going to talk about the two-year treasury having a higher yield than 10-year treasury. What does this tell us?
Typically, this tells us that the markets are more certain about economic activity over the next two years than the next 10 years. When the yield curve inverts, the bond market tells us that the growth rate of the economy is going to begin to slow.
The Correlation Between Inverted Yield Curves and Recessions
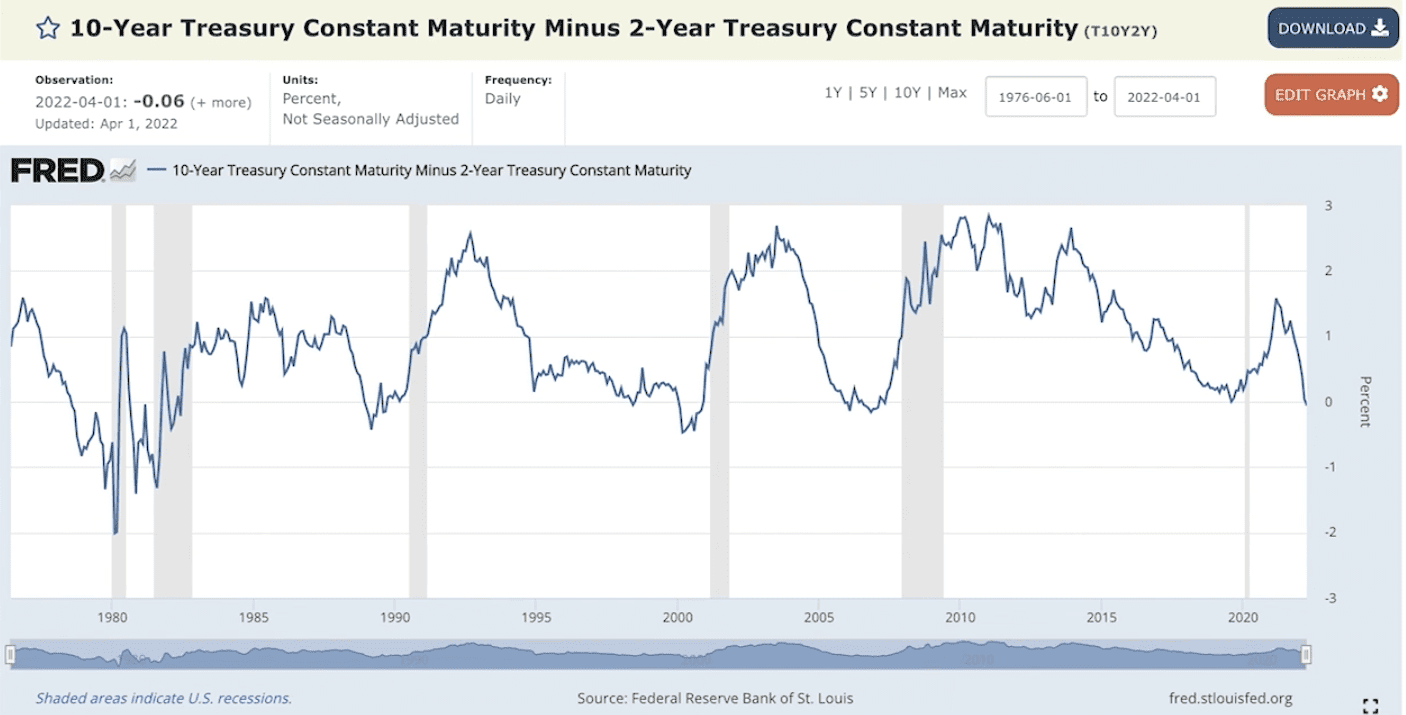
Just about every time that we’ve seen inverted yield curves, a recession has come some months later. A recession isn’t imminent. And there’s no guarantee that because we have an inverted yield curve that that means a recession is imminent. Let’s look at Figure 1, below, to see exactly what’s going on with inverted yield curve?
Recessions in the Early 1980s
Let’s start back in 1976. In 1976, there was a 1.59% in the 10-year treasury to the two-year treasury. In other words, the 10-year treasury had a 1.59% higher yield than the two-year treasury. By September 1978, the yield curve inverted. It was inverted in that period more than it ever has before. By October 1979, the two-year yield was 1.3% higher than the 10-year yield.
And then, of course, we had the recession beginning in early 1980. The yield curve inverted again in September 1980 before another recession from July 1981 until October 1982.
Now, Fast Forward a Decade to the Early 1990s
The Next time the yield curve inverted was January 1989. The recession occurred July 1990. That’s an 18-month difference. We had a more normal yield curve and a steep yield curve in the early 1990s. The yield curve inverted slightly in June 1998.
Looking Back at the Dot-Com Bubble
That was the first yield curve inversion prior to the 2000 Dot-Com Bubble bursting. It wasn’t, though, until February and March 2000 where we really saw a significant inversion. Those of you that remember the Dot-Com Bubble know that things had already started to unwind and stocks had already started to tumble. It wasn’t until April 2001 that the recession occurred.
An Early Warning Sign of The Great Recession
The next time the yield curve inverted was in February 2006. That was an early warning sign of The Great Recession, which began in January 2008.
And a Quick Flashback to the Last Inverted Yield Curve in 2019
Our yield curve inverted slightly in 2019. We saw a very brief recession after COVID hit. Now, we’re inverted again by six basis points.
Uncertainty Abounds in the Markets
I don’t tell you this and say that it’s time to run for the hills. With the yield curve inverting, inflation running rampant, and the Russia/Ukraine war, there are so many things that are uncertain in the markets right now. This warrants a time to be cautious. Even more important, this is a time to be patient. Don’t let your emotions get caught up in the short-term swings of what is happening in the markets.
What’s Going on in the Markets?
Speaking of which, let’s look at what has happened so far this year and in the past six months. As you’ll see, the activity has been all over the place. And I know you’ve felt it because you’ve seen how the markets have been up and down. We’ve had more volatility this year than we’ve had since the COVID crash at the beginning of 2020.
In Figure 2, we’re looking year to date at the different indices.
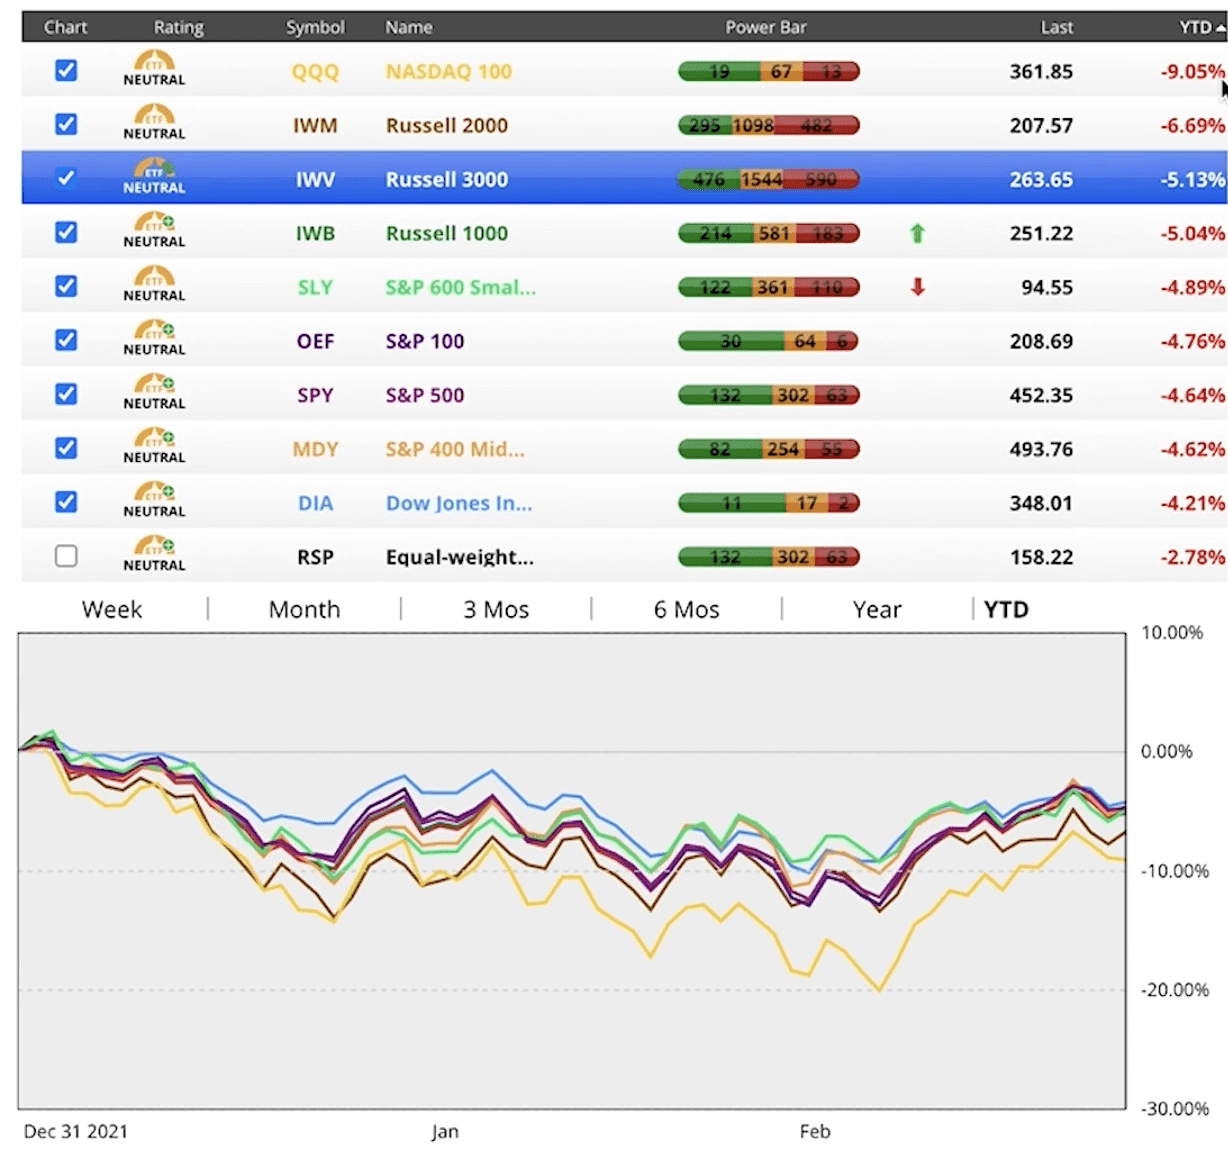
FIGURE 2 | Year to Date Market Performances | Chaikin Analytics
The NASDAQ 100 is the worst year to date at -9% as of April 4. The Russell 2000 is down -6.69%. Needless to say, every major indice is in negative territory so far this year. A lot more of our indices are now neutral plus. If you recall from last month, we only had a couple of indices that were neutral plus and the rest of them were in neutral territory. You can see in Figure 2 that there are more green stocks on the power bar, which means they’re bullish.
Now, let’s look below in Figure 3 to review the last six months.
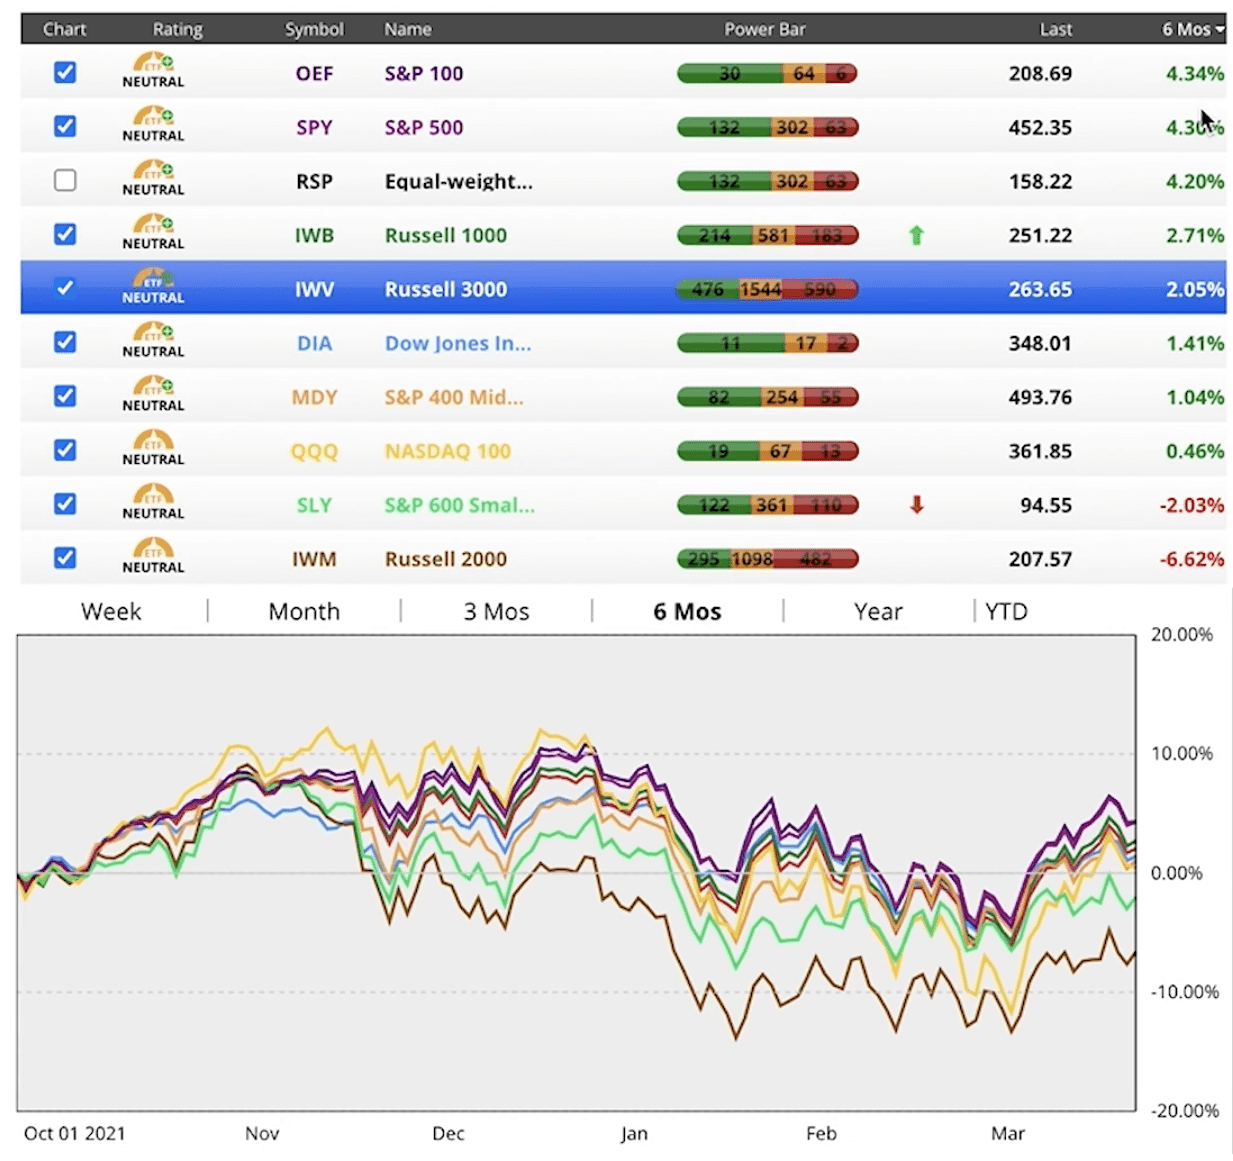
FIGURE 3 | Market Performances Over the Past Six Months | Chaikin Analytics
The S&P 100 is up 4.34%. The S&P are RSP Equal Weight are close behind, as they’re up 4.3% and 4.2%, respectively. But then, you have the Russell 2000 that’s at -6.62%, S&P 600 Small Market at -2.03%, and even the NASDAQ 100 has been flat over the past six months.
Where Do We Go from Here?
There has just been all kinds of choppiness and volatility. Most of the indices haven’t gone anywhere within the past six months. So, where does that take us? What does that mean? Where are we heading for the balance of the year due to this inverted yield curve?
Talk to Your Advisor
I think that we’re going to continue to see volatility. We need to be diligent and make sure that we’re not taking more risk than we need to within your portfolios. This would be a very good time to visit with your advisor at Modern Wealth Management and go through your financial plan. Let’s look at the least amount of risk that you could be taking within your portfolio and still have your plan with a high probability of success.
If you want to get a little more conservative, we can do the work behind the scenes. We can have a quick Zoom call with you and let you know how we can reduce the amount of equity exposure and keep your plan on track. If you’re comfortable where you’re at, that’s good too. Just make sure you keep the lines of communication open.
As always, we appreciate all the trust you put in us at Modern Wealth Management. We’ll keep a close eye on everything and we’ll talk to you again for the April Monthly Economic Update.
If you’re not a client, you can schedule a 20-minute ask anything session or a complimentary consultation with one of our CERTIFIED FINANCIAL PLANNER™ professionals. We can meet with you in person, virtually, or via phone. Thanks for joining us on the Monthly Economic Update.
Schedule a Conversation
Click below to select the office you would like to meet with and check the calendar. We can meet in person, by virtual meeting, or by phone. Then it’s just two simple steps to schedule a time for your conversation.
Get a Complimentary Consultation
Investment advisory services offered through Modern Wealth Management, Inc., an SEC Registered Investment Adviser.
The views expressed represent the opinion of Modern Wealth Management an SEC Registered Investment Advisor. Information provided is for illustrative purposes only and does not constitute investment, tax, or legal advice. Modern Wealth Management does not accept any liability for the use of the information discussed. Consult with a qualified financial, legal, or tax professional prior to taking any action.