Bear Markets and Mean Reversions
Key Points – Bear Markets and Mean Reversions
- Context for Today’s Volatility
- What Are Mean Reversions?
- Bear Market Rallies (or Dead Cat Bounces)
- Prepare, Act, and Stick to the Plan
- 7 Minutes to Read
Bear Markets and Mean Reversions
What It “Means” to You and How “Grizzly” It May Get
The first six months of this year have been trying to say the least. With wild swings in the markets in both directions almost daily, things can begin to feel like they are spiraling out of control. These unpredictable market conditions can make you nervous, unsettled, and on edge.
Times like these are when emotions tend to run high. I get it. But they are the times when it’s most important to resist the temptation to give in to those emotions. The reality is that if you have a solid plan which considers the possibility of a bear market during your retirement, you most likely do not need to worry. We’ve spent a lot of time taking these types of events into account when it comes to planning for our clients. This time is no different.
We believe that you need to understand what could possibly happen to prepare for/defend against it. And we spend an inordinate amount of time doing just that every day.
This article aims to show you a little behind-the-scenes look at the things we consider daily to make better decisions for our clients and their portfolios. Sometimes we don’t like what we see, but we must see it to be prepared.
Context for Today’s Volatility
Like I tell my clients, I’ll always tell you what you need to hear, not what you want to hear. So, we’ll put today’s volatility into context, both current and historical. The information you are about to read is not intended to be scary or hyperbolic but educational. Remember, educated decisions are far better than emotional ones. This is why we constantly consider things like this when planning for our clients and their portfolios.
The S&P 500 Index fell into official bear market territory on June 13. For those not familiar with the definition of a bear market, it is a 20% drop from the previous high, which in this case occurred on January 3. The question on everyone’s mind today is, how much lower can it go? It’s a question with no correct answer because we don’t know. However, we can make educated guesses based on historical trends and market behaviors.
What Are Mean Reversions?
We do know that markets that are overvalued, as today’s markets remain, tend to revert to their mean and often even below the mean. To the financial geeks, these events are called mean reversions.
We’re going to explore several methods of measuring how overvalued the markets became, how overvalued they remain, and how far they might fall if we are actually in the middle of a mean reversion event.
Let’s start with a valuation method developed by one of the most recognized names in the investment world, Warren Buffett. Oddly enough, it’s known as the Buffett Indicator. It simply divides the total value of the stock market by the Gross Domestic Product (GDP) of the U.S. economy. The result is the percentage ratio between the two. That percentage tells you whether the markets are fairly valued, overvalued, or undervalued, based on how many standard deviations the result is from the historical trend. Under one standard deviation is considered valued. Over one standard deviation is considered over/undervalued.
And anything greater than two standard deviations is considered strongly over/undervalued.
Historical Valuations and Mean Reversions
As you can see below in Figure 1, the market at the beginning of 2022 was strongly overvalued, greater than two standard deviations above fair value, and it was almost the same place it got to just before the Dot-Com Bubble burst in 2000. Since then, the indicator has fallen to just 0.7 standard deviations and is now in fairly valued territory. However, the market remains roughly 27% above the actual fair value line.
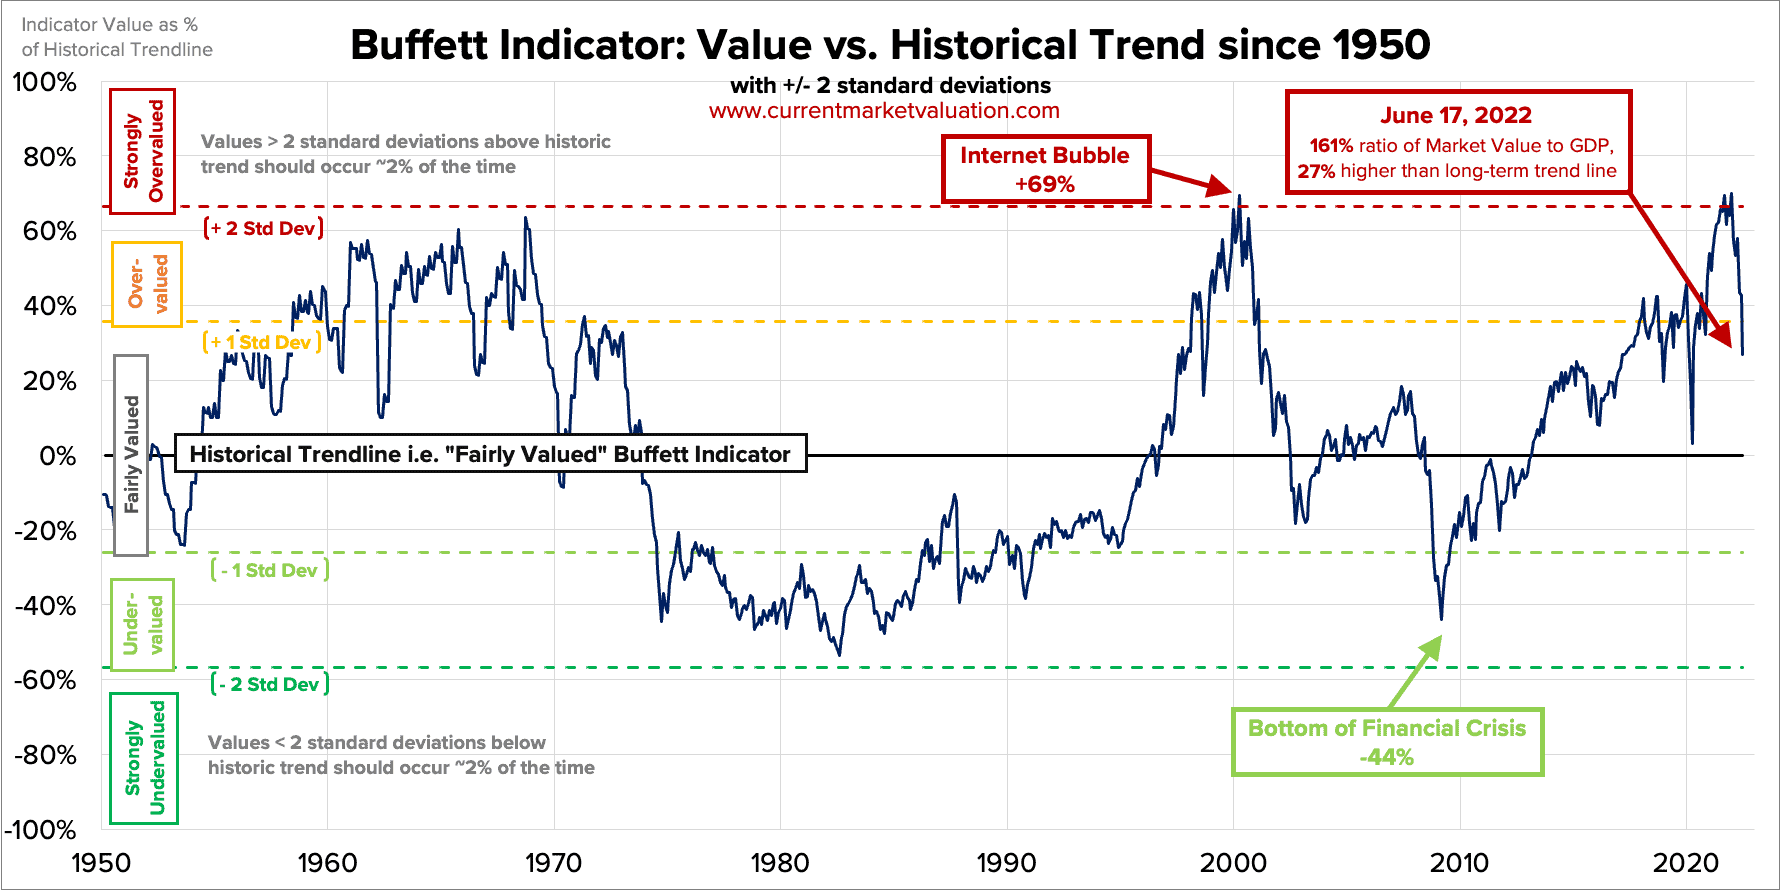
FIGURE 1 – Buffett Indicator: Value vs. Historical Trend Since 1950 – CurrentMarketValuation.com
That means that if this is a mean reversion event that we are living through, there is another 27% downside for the stock market to get back to the fair value line. But as I mentioned earlier, mean reversion events tend to overshoot to the downside, hitting or exceeding one standard deviation below fair value. If that were to be the case, the additional downside the market could see would be north of 40%. With the S&P 500 down about 21%, that would represent a total potential loss of over 60% by the end of the mean reversion.
Conversely, the market may settle in the <1 standard deviation, or fair value range, as it did during the 2020 drop due to COVID, and the worst may be over. Unfortunately, we don’t and can’t know the real answer until it plays itself out.
What About GDP?
We can also estimate what might happen using historical market levels and GDP numbers.
Looking below at Figure 2, we can see that the S&P 500 dropped to 676 in 2009, which was 44% below the fair value line on the Buffett Indicator. GDP in 2008 was $14.769 trillion. GDP for 2022 is estimated to be $24.4 trillion, or 40% greater than before the Financial Crisis. If we assume that the bottom could be somewhere in the neighborhood of 40% higher than the bottom in 2009, that would indicate an S&P 500 level of around 950.
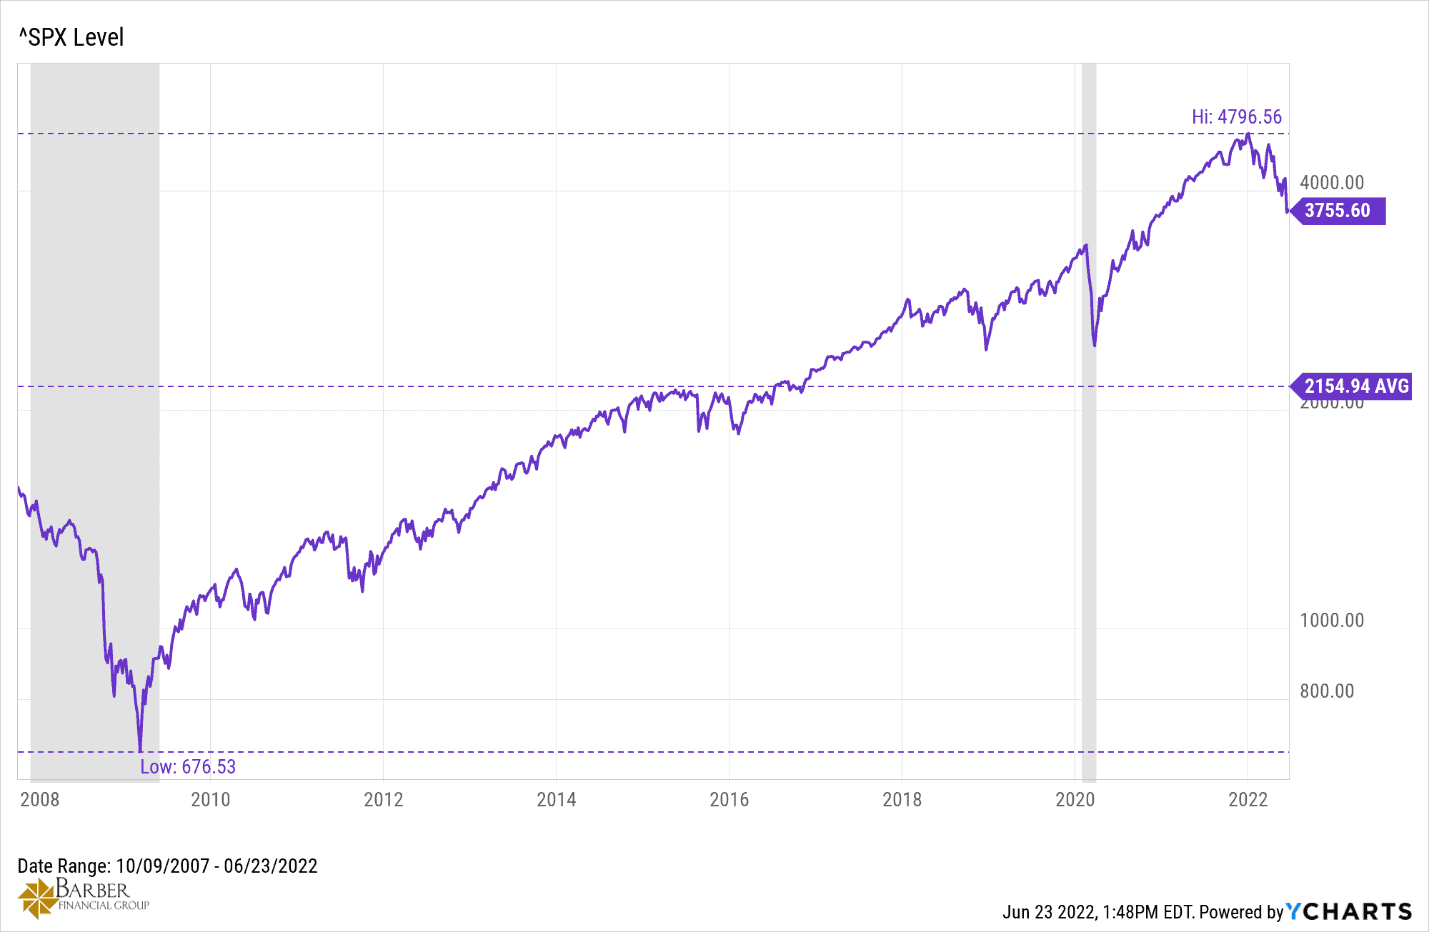
FIGURE 2 – SPX Level – YCharts
However, if we go from the current S&P 500 level of 3755 and subtract the 27% remaining till the historical fair value trend line of 121% of GDP, then the 21% to match GDP and then the 44% below fair value that we hit back in 2009, that would indicate a bottom of around 1200 on the S&P 500.
So, if things really do go to hell in a hand basket, our bottom is somewhere between 950 to 1200 or 68% below current levels. Bear markets are volatile, to say the least, and they display some typical behaviors.
Bear Market Rallies (or Dead Cat Bounces)
As you can see below in Figure 3, the trend is always downward, and they have consistently lower highs and lower lows, interspersed with violent upswings. We call these upswings bear market rallies or dead cat bounces.
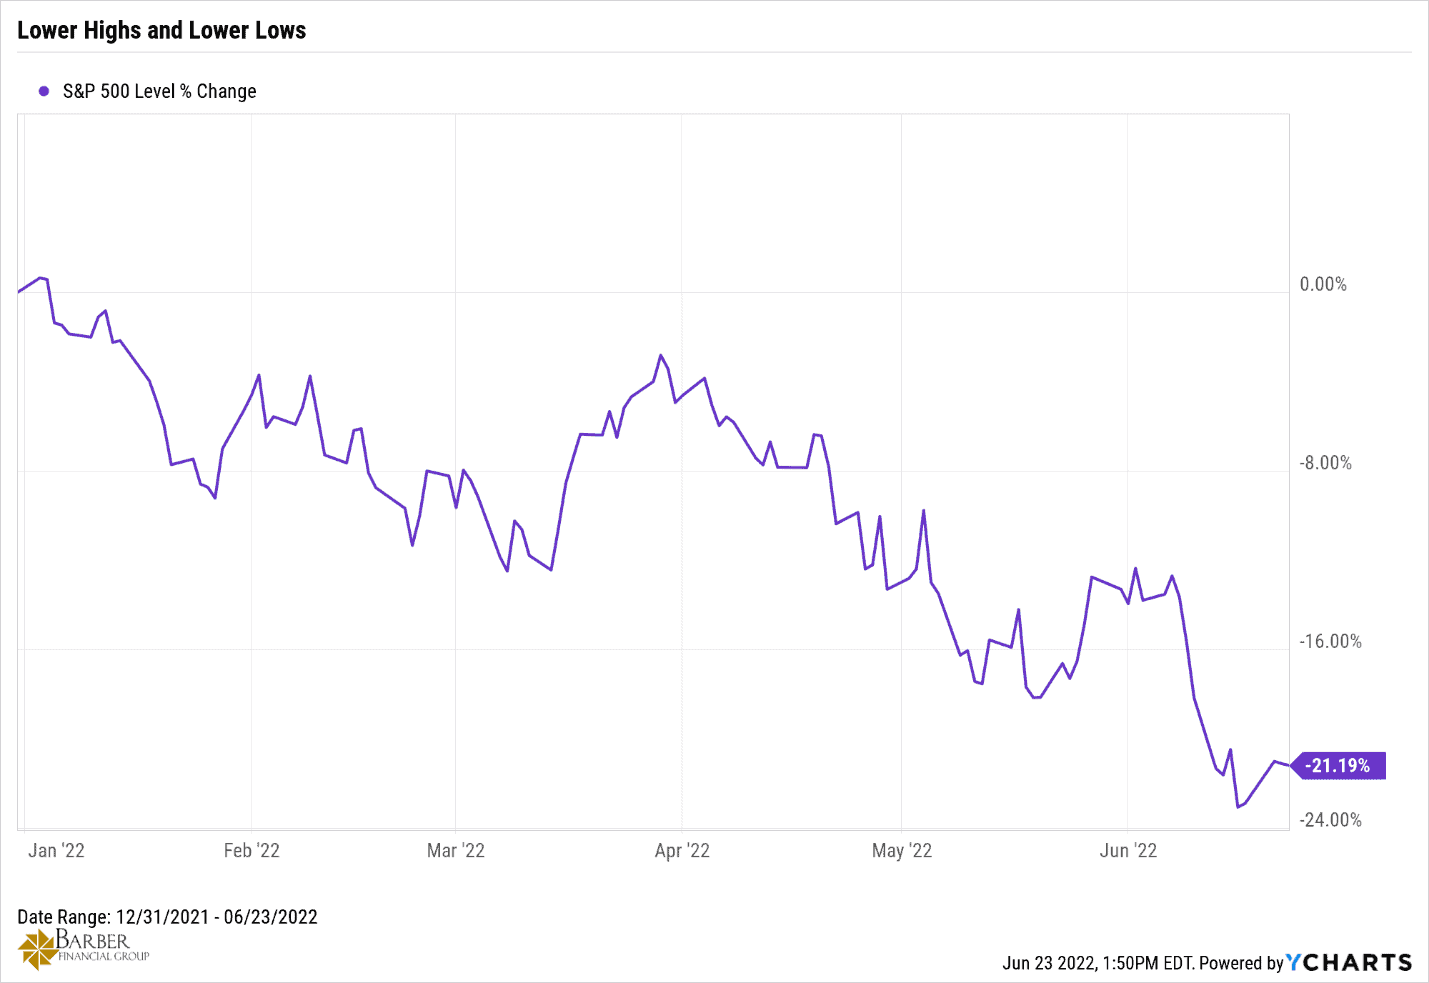
FIGURE 3 – Lower Highs and Lower Lows – YCharts
They can, and do, convince unsuspecting investors that a bottom has been put in and that things are looking up.
Buying into these bear market rallies is akin to catching a falling knife, something best avoided. Get your feet out of the way and let the knife hit the floor; then, you can safely pick it up.
Better Understanding Market Valuations
The last method of valuing the market that we’ll look at is a combination of four separate methods of valuation, all combined into one. If you’ve read my articles over the past several years, you’ll be familiar with them.
It’s published monthly by our friends at Advisor Perspectives, and I refer to their wealth of data almost daily. This indicator doesn’t have its own name, though I think they should name it just for fun. It combines the Crestmont P/E, the Shiller or Cyclical P/E, the Q Ratio, and the S&P Composite Regression.
The indicator takes each of these methods, adds them together, and uses the average of the four to plot the market valuation. Though the data is calculated daily, the chart is only published monthly.
Valuations Are Coming Down
Figure 4, below, was published in June and represents the data through the end of May. The market is off by 9% since the beginning of June, so the indicator value is likely lower today than at the end of May. For instance, the Cyclical P/E was at 33, or 95% above its mean of 16.95 at the end of May. Today, it sets at 29.19 or roughly 75% above the mean. So, valuations are definitely coming down.
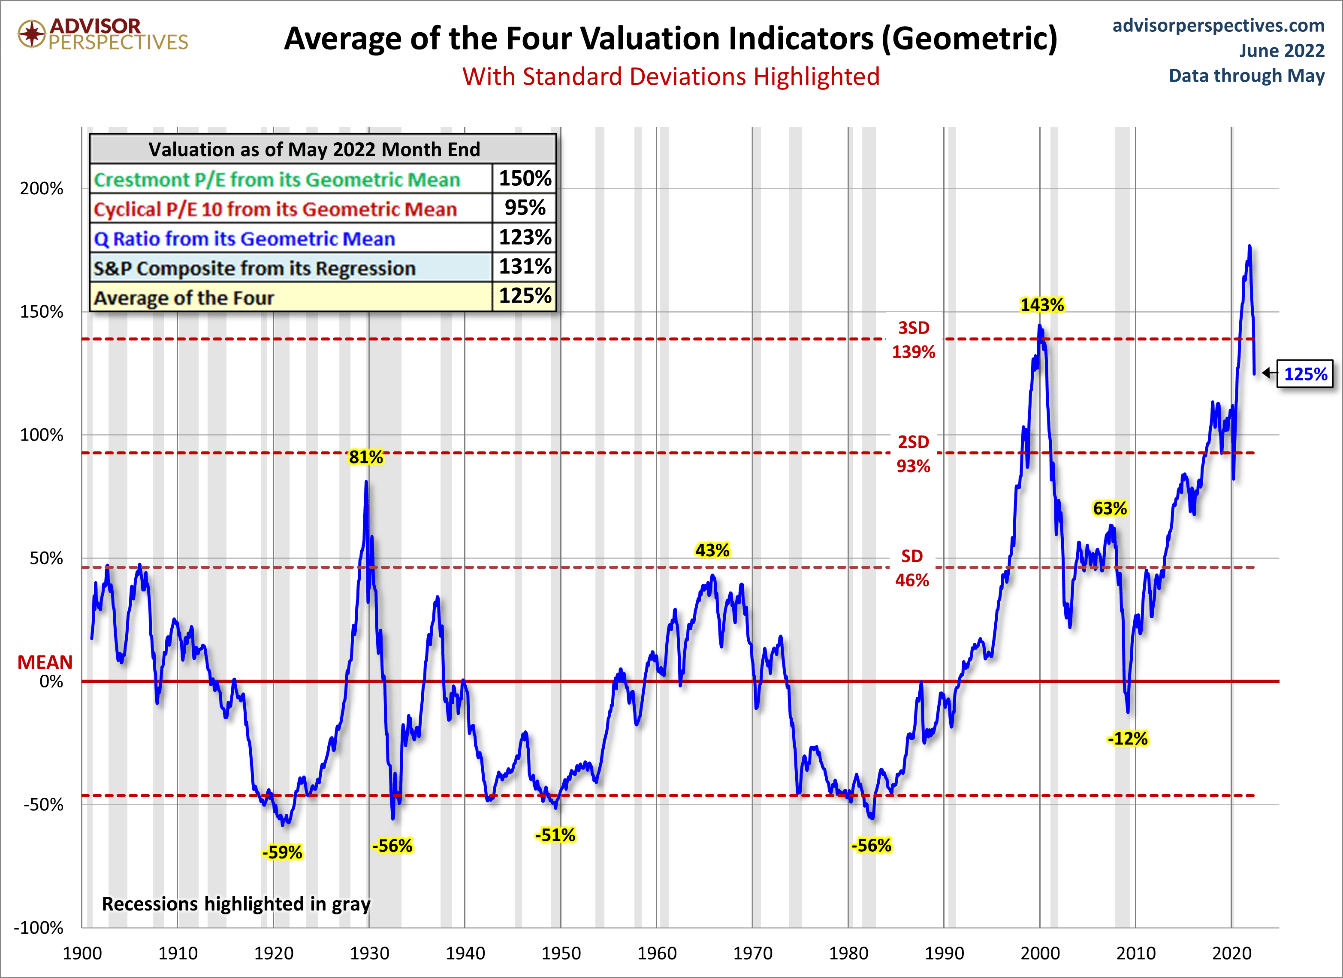
FIGURE 4 – Average of the Four Valuation Indicators (Geometric) – Advisor Perspectives
At the beginning of the year, the indicator was at roughly 180%, well over three standard deviations, over the mean valuation. It’s worth noting that 98.9% of all observations are less than three standard deviations from the mean, and events outside of three standard deviations are considered Black Swan events. At the end of May, it was just 125% over the mean, and by the end of this month, it will likely be closer to 110%, closing in on dropping below two standard deviations.
Notice in Figure 4 that when the Dot-Com Bubble burst, the indicator was at 143% above the mean and never returned to the mean.
Instead, it settled in the <1 standard deviation range and only increased to 63% above the mean before the Financial Crisis of 2008. It took the financial crisis to bring valuations down below the mean, and it’s been off to the races from there until this year.
Prepare, Act, and Stick to the Plan
So, the question remains, what will happen this time? The answer is not to try to predict the future. The answer is to learn from the past, prepare your portfolio, act rather than being frozen with fear, and have a plan and stick to it.
If you already have a plan we’ve built for you, rest assured we’ve already stress-tested your plan against these possible outcomes. We’ve taken steps to prepare your portfolio for all the possibilities we’ve discussed here today.
Don’t have a plan? Don’t know how to prepare your portfolio? We can help with that. All you have to do click here or below and schedule a conversation. We’re happy to build your plan and help you prepare your portfolio.
Don’t let the “Bear” cause you to live in fear. You have the “Means” to best avoid him.
Schedule Complimentary Consultation
Select the office you would like to meet with. We can meet in person, by virtual meeting, or by phone. Then it’s just two simple steps to schedule a time for your Complimentary Consultation.
Lenexa Office Lee’s Summit Office North Kansas City Office
Investment advisory services offered through Modern Wealth Management, Inc., an SEC Registered Investment Adviser.
The views expressed represent the opinion of Modern Wealth Management an SEC Registered Investment Advisor. Information provided is for illustrative purposes only and does not constitute investment, tax, or legal advice. Modern Wealth Management does not accept any liability for the use of the information discussed. Consult with a qualified financial, legal, or tax professional prior to taking any action.