Consumer Debt Is at an All-Time High
Key Points – Consumer Debt Is at an All-Time High
- The Latest Look at Inflation
- What’s Going on the Consumer Spending and Consumer Debt?
- The Federal Reserve’s Tight Rope Walk Continues
- U.S. Treasuries Yield Curve Remains Inverted
- February Filled with Negative Market Performances
- 5 Minutes to Read | 7 minutes to Listen
The data in today’s article is as of March 2, 2023.
Inflation and Consumer Demand
The Federal Reserve’s battle with inflation and rising interest rates are things that we’ve talked about for more than a year now. But one thing we haven’t talked too much about recently is the issue with consumer debt. We’ll dive into what’s going on with consumer debt, consumer spending, and much more in our latest Monthly Economic Update.
What Does the Future of Inflation Hold?
Remember that the consumer is responsible for 70% of our Gross Domestic Product. A lot of what’s happening with inflation has to do with consumer demand. As we look at consumer demand, I want to analyze a couple of different pieces today to see if we can make some sense out of what’s happening with inflation and what the future of inflation holds.
Consumer Debt Has Sky-Rocketed Since the Onset of COVID-19
Let’s start with Figure 1 below, which looks at total consumer debt.
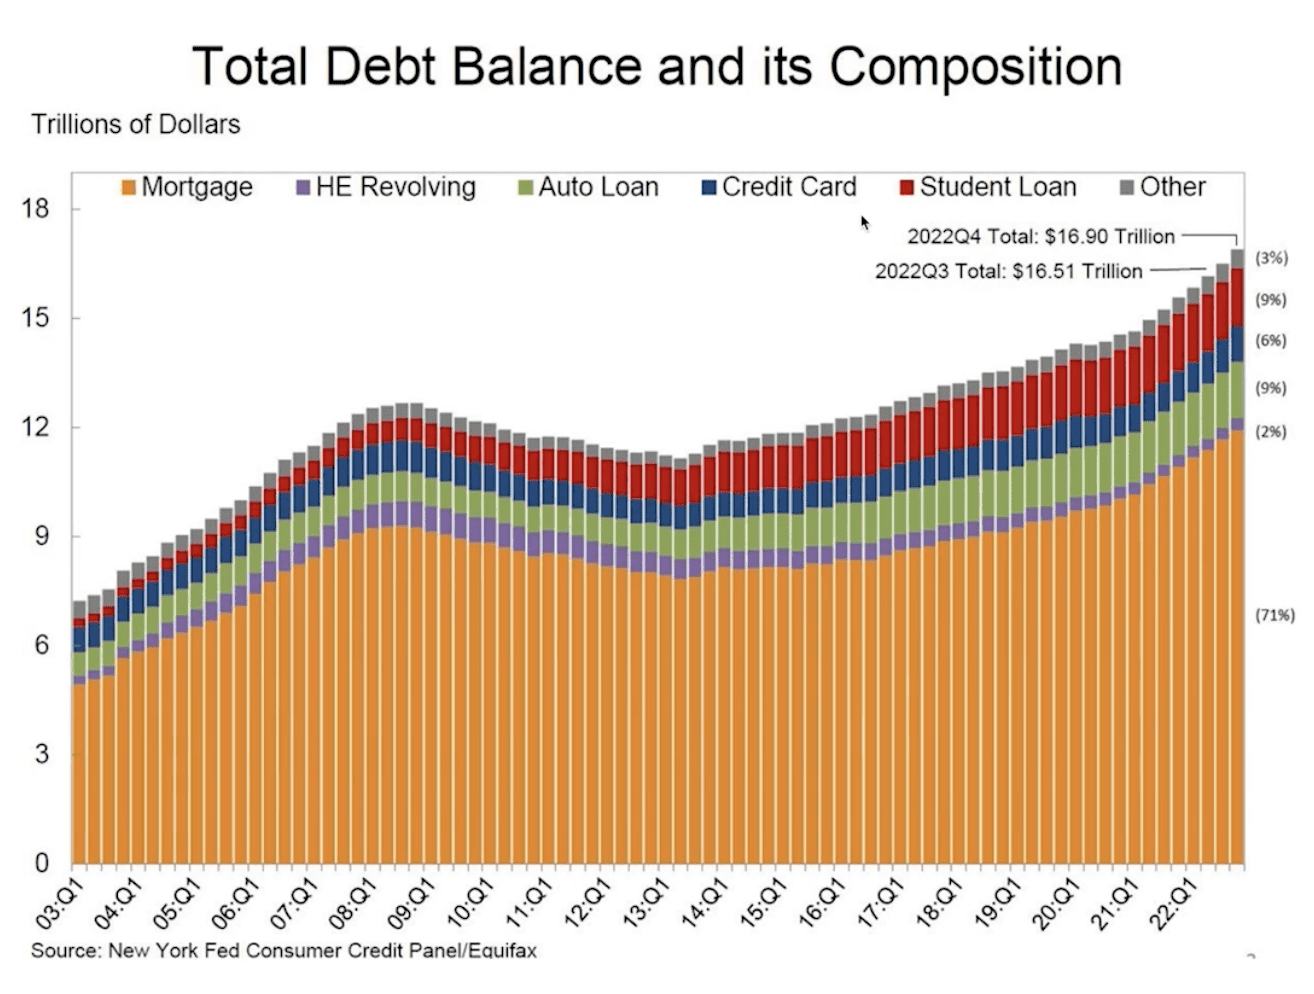
FIGURE 1 – Total Debt Balance and Its Composition – New York Fed Consumer Credit Panel/Equifax
As you can see, we have mortgage debt, revolving debt, auto loans, credit card debt, student loan debt, and other forms of consumer debt. I want to focus specifically on when we were coming off 2020 and the COVID-19 pandemic hitting. Consumer debt has gone up parabolically since COVID hit.
Comparing Consumer Debt to the U.S. Savings Rate
At the close of Q4 2022, the consumer was in debt to the tune of $16.9 trillion. Consumer debt is at an all-time high. We want to compare consumer debt to the U.S. savings rate, which is the rate that the consumer is saving. Below in Figure 2, you can see the consumer savings rate dating back to 2000.
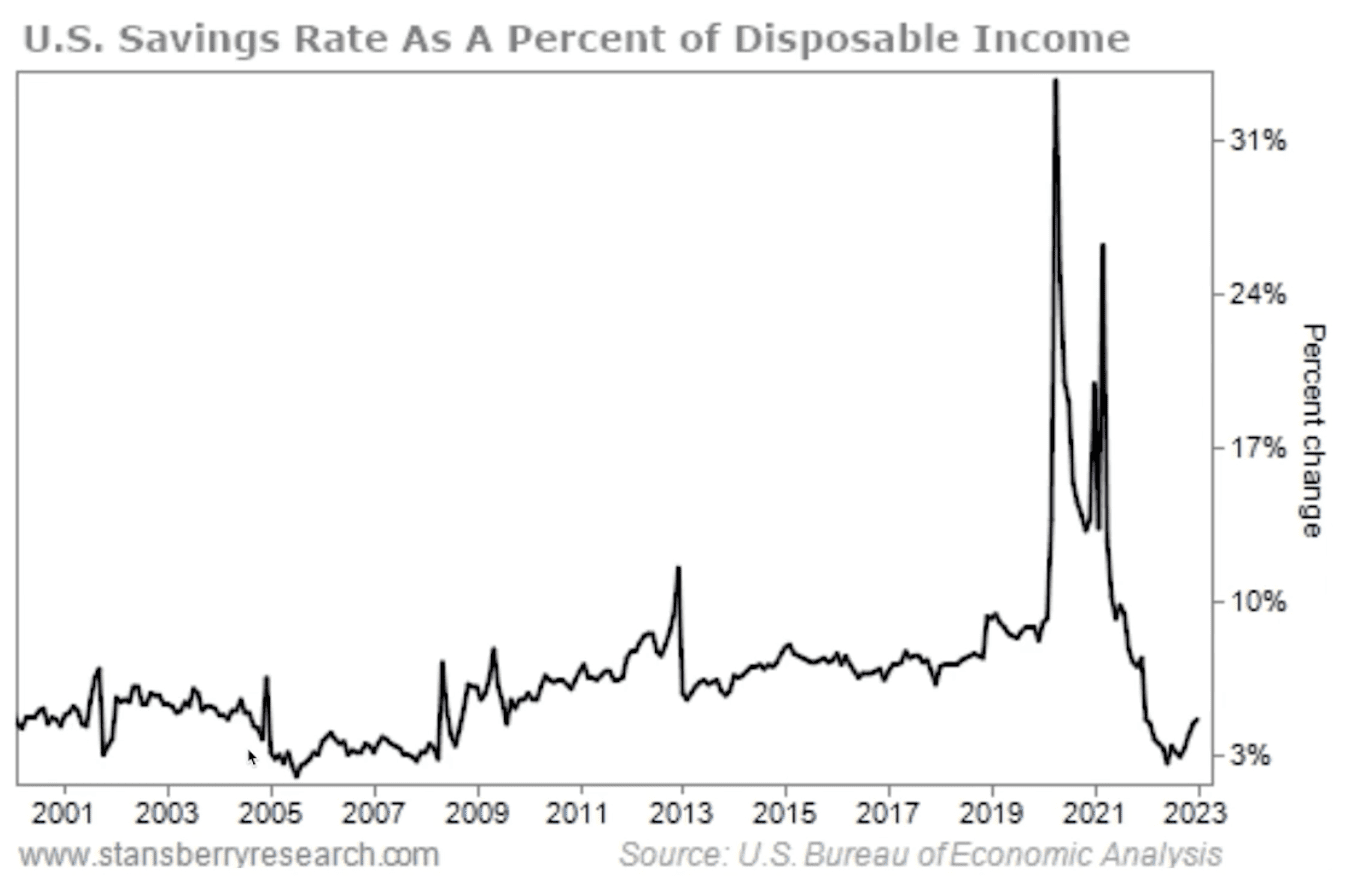
FIGURE 2 – U.S. Savings Rate as a Percent of Disposable Income – U.S. Bureau of Economic Analysis
Consumer Saving Is Down; People Are Borrowing More to Spend
We’ve had some spikes in this timeframe. The highest spikes were following the beginning of COVID and early 2021, but we nearly bottomed out late last year. At today’s level of a little more than 4%, we’re still well below the average coming out of the Great Recession.
When you combine those two things together, it tells the story of a consumer who is tapping out. They’re not saving nearly as much. And what they are spending appears to be deficit spending. They’re borrowing money to do that. Credit card debt, automobile loans, and debt on real estate are at all-time highs. That all goes into why consumer debt is at an all-time high.
Why Does Consumer Spending Matter?
The reason that I think this is important is because as the Federal Reserve continues to raise interest rates, it continues to make borrowing more expensive for the consumer. I believe that the consumer will be forced to cut back. And as the consumer, that decreases the demand for goods and services. That should be good news for inflation.
Remember that the markets don’t like uncertainty. The biggest uncertainty right now is Jerome Powell and the Federal Reserve and how far they’ll need to go to stop inflation. They’ve said several times that they’re going to do whatever it takes to stop inflation and hope to do it with what they consider to be a soft landing. They want to do it without putting the economy into a recession.
Another Look at the U.S. Treasuries Yield Curve
The next thing I’m going to show you in Figure 3 is something I’ve shown you for several months now. It’s the U.S. Treasuries yield curve.
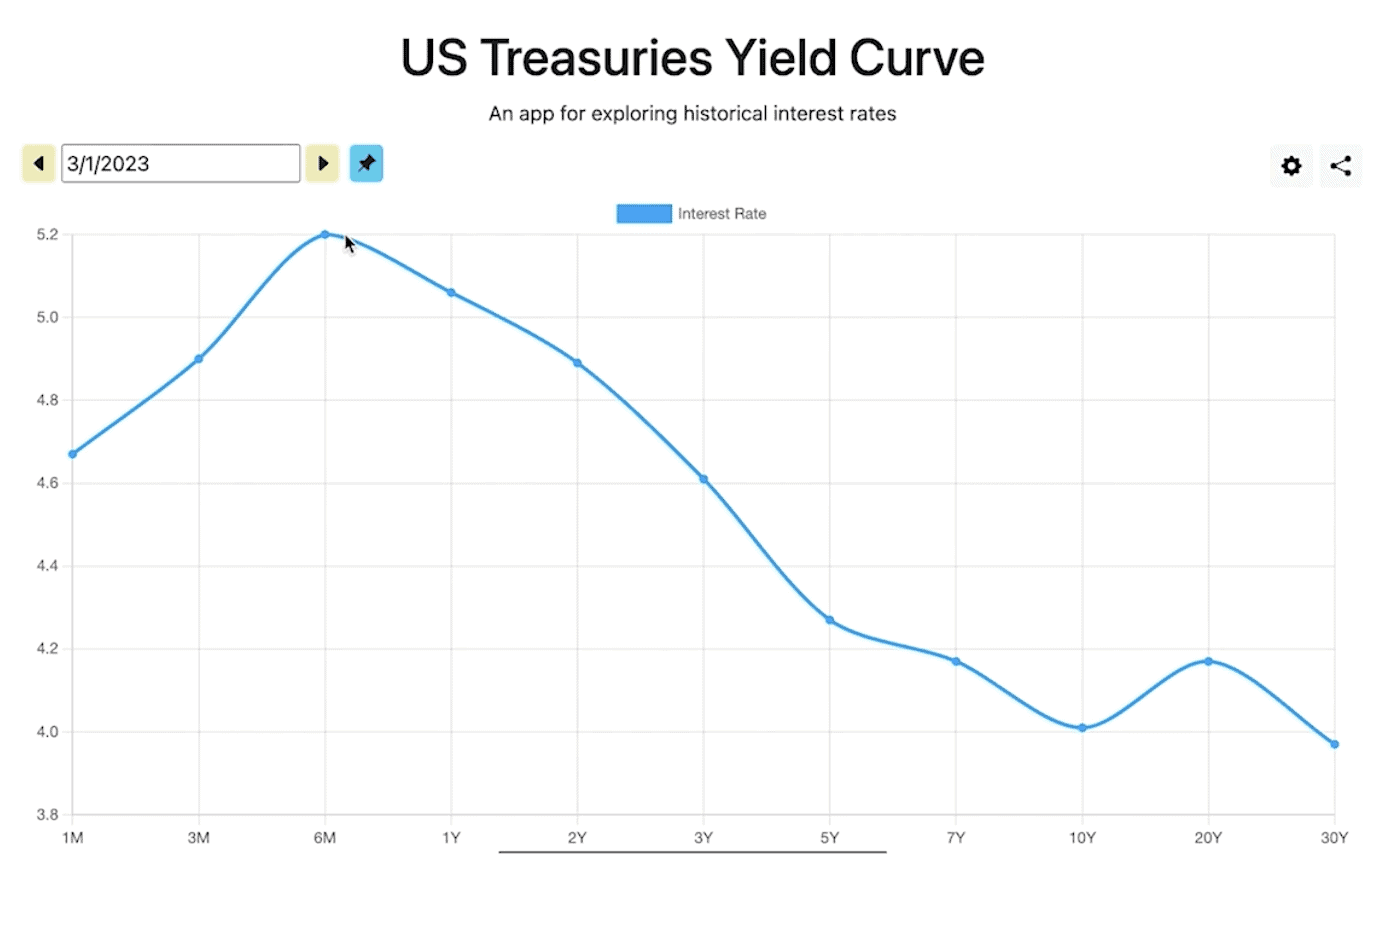
FIGURE 3 – U.S. Treasuries Yield Curve – U.S. Treasury
You can see that the yield curve is still inverted. The six-month rate on U.S. treasuries are now at 5.2%. Meanwhile, the 10-year treasury is at 4.01%. You can get 1.2% more yield on a six-month treasury than you can on a 10-year treasury. From a historical perspective, every time that there’s been a yield curve that’s been inverted, it’s led to a recession. The depth and duration of those recessions have varied.
Market Performances
The Federal Reserve is still walking a tightrope. They need to kill inflation but need to do so with causing the least amount of damage to the economy as possible. So, how does that all translate to the markets? Let’s look at what went on in February, beginning with Figure 4 below.
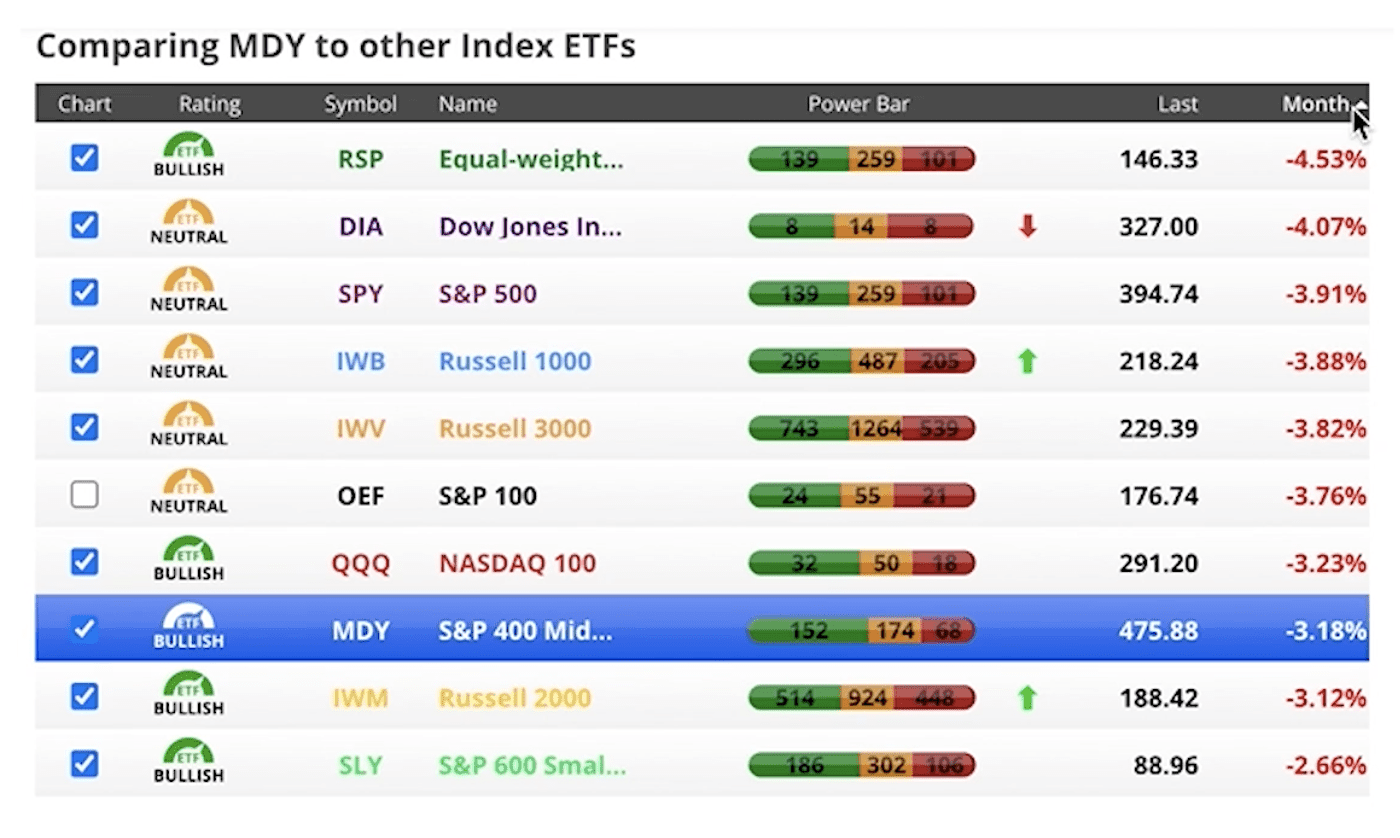
FIGURE 4 – February Market Performances – Chaikin Analytics
For February, we saw just about every major index in negative territory. We were at -4.53% on the equal-weighted S&P 500 index, -4.07% on the Dow Jones Industrial Average, and -3.91% on the S&P 500. The best performing for February was the S&P 600 Smallcap at -2.66%. Now, let’s look at market performances on a year-to-date basis in Figure 5.
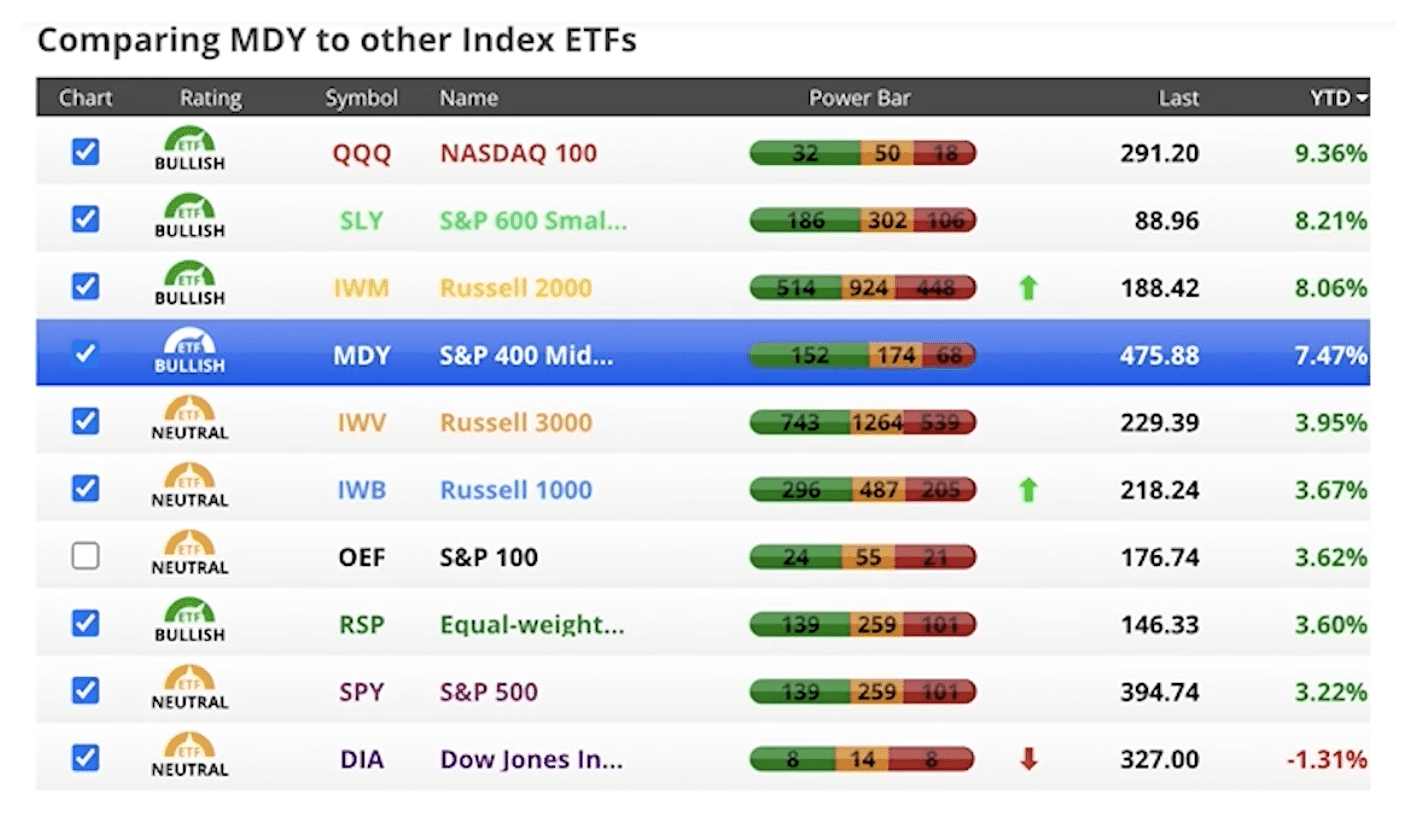
FIGURE 5 – Year-to-Date Market Performances – Chaikin Analytics
On a year-to-date basis, we do have some positive numbers. Although February did take away a lot of those positive numbers. The NASDAQ is the best performing index year-to-date at 9.36%. The worst is the Dow Jones Industrial Average at -1.31%.
I’ve been pointing out the neutral or bullish ratings on these different indices in recent months as well. Last month, more of them were pointing toward bullish than neutral. We still don’t have any of them that are bearish. Now, let’s look back over the past year in Figure 6 to get a longer-term perspective.
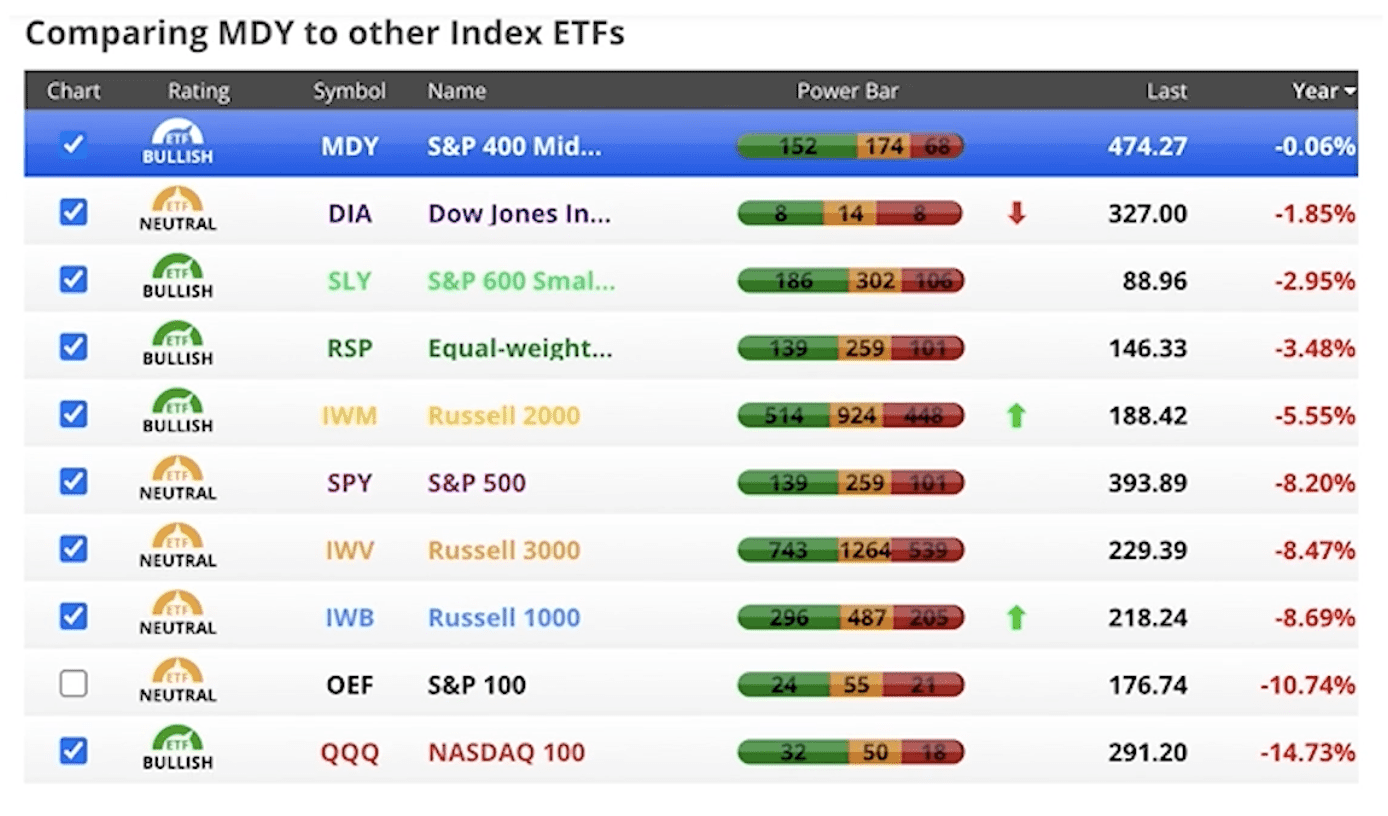
FIGURE 6 – Past Year Market Performances – Chaikin Analytics
Your best performer is the S&P 400 Midcap at -0.06%. While the NASDAQ is the best year-to-date, it’s the worst over a one-year period at -14.73%.
What to Make of These Market Performances
So, where does all this leave us? Until we have certainty that the Federal Reserve has been successful at killing inflation, I believe we’ll continue seeing volatile markets. Does that mean we’ll have a 15-20% downturn from here? Nobody knows the answer to that. But I do know that the Fed will get inflation under control. I believe that will happen this year.
When the Fed is clear that inflation is under control and can stop raising rates, I believe the markets will take off. We’ll continue to keep you informed, as we’re looking at these things every day. If you’re a Modern Wealth Management client, make sure to keep the lines of communication open with your financial advisor.
If you’re not a Modern Wealth Management client, we want to make sure that you have a financial plan so you can understand the impact that all this has on you. We can help get you started with building a financial plan in a few different ways. First, check out our industry-leading financial planning tool. You can use the same tool that our CFP® Professionals use with our clients from the comfort of your own home and at no cost or obligation. Just click the “Start Planning” button below to begin building your plan today.
Stay in the Know with Our 2023 Retirement Planning Calendar
There’s also another new resource that we have this year that we want our clients and all retirees and near retirees to check out. That’s our 2023 Retirement Planning Calendar. It highlights several dates, events, and milestones that can impact your retirement that you need to be aware of. Make sure to download your copy below.

And as always, we welcome the opportunity to meet with anyone who isn’t a Modern Wealth Management client during a 20-minute “ask anything” session or complimentary consultation. We’re passionate about helping anyone and everyone live their one best financial life leading up to and in retirement. You can schedule a meeting with one of our CFP® Professionals—in person, virtually, or by phone—by clicking here. We hope to hear from you soon and make sure to stay tuned for March’s Monthly Economic Update.
Schedule a Complimentary Consultation
Click below to get started. We can meet in-person, by virtual meeting, or by phone. Then it’s just two simple steps to schedule a time for your Complimentary Consultation.
Investment advisory services offered through Modern Wealth Management, LLC, an SEC Registered Investment Adviser.
The views expressed represent the opinion of Modern Wealth Management an SEC Registered Investment Adviser. Information provided is for illustrative purposes only and does not constitute investment, tax, or legal advice. Modern Wealth Management does not accept any liability for the use of the information discussed. Consult with a qualified financial, legal, or tax professional prior to taking any action.